

Mathematics, 26.06.2019 22:00, michelle230
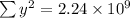
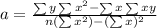
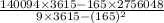
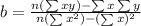
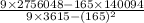
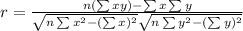
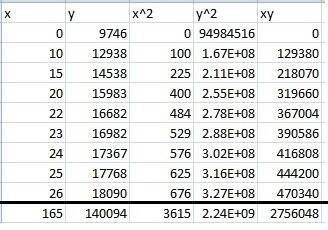
Problem: use a graphing calculator to find the equation of the line of best fit for the data below. let x = 0 represent 1980, x = 10 represent 1990, x = 15 represent 1995, and so on. florida resident population (in thousands) year 1980 1990 1995 2000 2002 2003 2004 2005 2006 population 9,746 12,938 14,538 15,983 16,682 16,982 17,367 17,768 18,090 what is the equation of the line of best fit? describe how you found this equation. what is the slope of the line of best fit? what does this value tell you about florida’s population growth? (2 points) what is the correlation coefficient? what does this value tell you about your data? (1 point) according to the data, what will the estimated resident population be in the year 2018? be sure to show how you arrived at your answer. (2 points) can someone me awnser these asap.

Answers: 1


Other questions on the subject: Mathematics
Mathematics, 21.06.2019 17:30, 4presidents
Tom wants to order tickets online so that he and three of his friends can go to a water park the cost of the tickets is 16.00 per person there is also a 2.50 one-time service fee for ordering tickets online write an expression in term of n that represents the cost for n ordering tickets online
Answers: 1
Mathematics, 21.06.2019 20:30, corbeansbrain
Someone answer asap for ! michele pushes a box d meters across a floor. she uses a force f, in newtons, to push the box. she pushes the box for t seconds. the formula p = fd/t calculates the power, p, in watts, that it takes for michele to complete the task. solve the formula for d.
Answers: 2
Mathematics, 21.06.2019 22:00, hannahpalmario
The customer price index(cpi), which measures the cost of a typical package of customer goods, was 208.8 in 2011 and 244.1 in 2016.let x=11 corresponding to the year 2011 an estimate to cpi into 2013 and 2014. assume that the data can be modeled by a straight line and the trend to continue idenfinitely. use data points to find such a line and then estimate the requested quantities
Answers: 1
Mathematics, 22.06.2019 00:30, valdezangie10
Fiona has to plot a histogram of the given data
Answers: 1
Do you know the correct answer?
Problem: use a graphing calculator to find the equation of the line of best fit for the data below....
Questions in other subjects:
Mathematics, 16.04.2021 21:30
Mathematics, 16.04.2021 21:30
Mathematics, 16.04.2021 21:30
Mathematics, 16.04.2021 21:30
Mathematics, 16.04.2021 21:30


