

Mathematics, 27.06.2019 04:30, cameronbeaugh
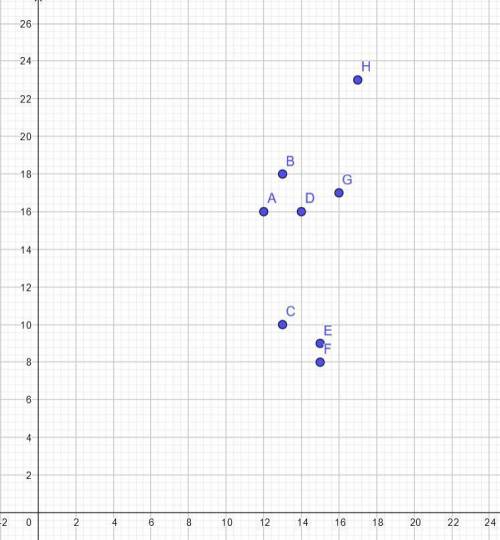
The coordinate points below show part of the data collected by the cell phone company, where x is age in years and y is texting speed in words per minute. (12, 16), (13, 18), (13, 10), (14, 16), (15, 9), (15, 8), (16, 17), (17, 23) if this data was plotted on a scatterplot, would there be a relationship between the variables? if yes, explain the relationship. yes, there is a relationship. as age increases, texting speed also increases. yes, there is a relationship. as age increases, texting speed decreases. yes, there is a relationship. as texting speed decreases, age also decreases. no, there is no clear relationship between age and texting speed.

Answers: 1


Other questions on the subject: Mathematics
Mathematics, 21.06.2019 17:00, michibabiee
Sole with work in 10 years, the average number of hours of tv watched per week by teenagers dropped from 23.9 to 21.4. find the percent of change.
Answers: 1
Mathematics, 21.06.2019 17:40, angelica3752
Solve the given system of equations. 2y= -x+9 , 3x-6= -15
Answers: 2
Mathematics, 21.06.2019 20:30, shelbylynn17
The function show two sisters' savings account and the rate at which they plan to deposit money
Answers: 3
Do you know the correct answer?
The coordinate points below show part of the data collected by the cell phone company, where x is ag...
Questions in other subjects:


Mathematics, 20.08.2021 19:30

Physics, 20.08.2021 19:30
English, 20.08.2021 19:30


Social Studies, 20.08.2021 19:30


