

Mathematics, 28.06.2019 14:30, elijahcarson9015
Is this true or false? the following graph represents a proportional relationship: a graph is shown. the values on the x axis are 0, 2, 4, 6, 8, and 10. the values on the y axis are 0, 6, 12, 18, 24, 30. points are shown on ordered pairs 0, 0 and 2, 6 and 4, 12 and 6, 18 and 8, 27. these points are connected by a line. the label on the x axis is bunches of thyme. the title on the y axis is price of bunches. sorry i dont know how to put pictures in true false

Answers: 2


Other questions on the subject: Mathematics
Mathematics, 21.06.2019 16:10, cthompson1107
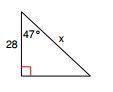
Which expression gives the area of the triangle shown below
Answers: 1
Mathematics, 21.06.2019 17:00, joejoefofana
Simone claims the initial value and y-intercept are the same thing on a graph. is she correct? if you know that a line has a slope of and a y-intercept of 7, what is the equation for that line in slope-intercept form?
Answers: 1
Do you know the correct answer?
Is this true or false? the following graph represents a proportional relationship: a graph is show...
Questions in other subjects:

Mathematics, 26.03.2021 19:50

Arts, 26.03.2021 19:50

Mathematics, 26.03.2021 19:50

Physics, 26.03.2021 19:50


