

Mathematics, 28.06.2019 20:30, k3rbycalilung
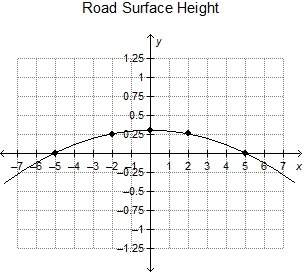
The quadratic regression graphed on the coordinate grid represents the height of a road surface x meters from the center of the road. what does the graph of the regression model show? the height of the surface decreases from the center out to the sides of the road. the height of the surface increases, then decreases, from the center out to the sides of the road. the height of the surface increases from the center out to the sides of the road. the height of the surface remains the same the entire distance across the road.

Answers: 1

![(0,5]](/tpl/images/0028/4273/bb442.png)


Other questions on the subject: Mathematics
Mathematics, 21.06.2019 22:20, KillerSteamcar
Which strategy is used by public health to reduce the incidence of food poisoning?
Answers: 2
Mathematics, 22.06.2019 01:30, wendelljo61
David is standing on the sixth rung of a ladder while painting his house. which expressions represent a change in david’s position of 2 rungs on the ladder? choose exactly two answers that are correct. a. 6+2 b. 6-2 c. 2x6 d. 6/2
Answers: 1
Do you know the correct answer?
The quadratic regression graphed on the coordinate grid represents the height of a road surface x me...
Questions in other subjects:

Social Studies, 23.02.2021 23:40

Biology, 23.02.2021 23:40
Mathematics, 23.02.2021 23:40

Mathematics, 23.02.2021 23:40
Mathematics, 23.02.2021 23:40


