

Mathematics, 29.06.2019 08:30, genyjoannerubiera
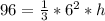
Catherine is a making a gift container in the shape of a square pyramid. one of the side of the square base is 6 in. long and the volume of the container is 96 in? . what is the height of the pyramid? enter your answer in the box. _in

Answers: 1


Other questions on the subject: Mathematics
Mathematics, 21.06.2019 21:20, madisontrosclair2
Amajor grocery store chain is trying to cut down on waste. currently, they get peaches from two different distributors, whole fruits and green grocer. out of a two large shipments, the manager randomly selects items from both suppliers and counts the number of items that are not sell-able due to bruising, disease or other problems. she then makes a confidence interval. is there a significant difference in the quality of the peaches between the two distributors? 95% ci for pw-pg: (0.064, 0.156)
Answers: 3
Mathematics, 22.06.2019 00:30, ERIKALYNN092502
The scatter plot shows the number of animal cells clara examined in a laboratory in different months: plot ordered pairs 1, 20 and 2, 60 and 3,100 and 4, 140 and 5, 180 what is the approximate predicted number of animal cells clara examined in the 9th month?
Answers: 3
Mathematics, 22.06.2019 01:00, s27511583
The weight of 46 new patients of a clinic from the year 2018 are recorded and listed below. construct a frequency distribution, using 7 classes. then, draw a histogram, a frequency polygon, and an ogive for the data, using the relative information from the frequency table for each of the graphs. describe the shape of the histogram. data set: 130 192 145 97 100 122 210 132 107 95 210 128 193 208 118 196 130 178 187 240 90 126 98 194 115 212 110 225 187 133 220 218 110 104 201 120 183 124 261 270 108 160 203 210 191 180 1) complete the frequency distribution table below (add as many rows as needed): - class limits - class boundaries - midpoint - frequency - cumulative frequency 2) histogram 3) frequency polygon 4) ogive
Answers: 1
Mathematics, 22.06.2019 02:00, mathhelppls14
1. the manager of collins import autos believes the number of cars sold in a day (q) depends on two factors: (1) the number of hours the dealership is open (h) and (2) the number of salespersons working that day (s). after collecting data for two months (53 days), the manager estimates the following log-linear model: q 4 equation 1 a. explain, how to transform the log-linear model into linear form that can be estimated using multiple regression analysis. the computer output for the multiple regression analysis is shown below: q4 table b. how do you interpret coefficients b and c? if the dealership increases the number of salespersons by 20%, what will be the percentage increase in daily sales? c. test the overall model for statistical significance at the 5% significance level. d. what percent of the total variation in daily auto sales is explained by this equation? what could you suggest to increase this percentage? e. test the intercept for statistical significance at the 5% level of significance. if h and s both equal 0, are sales expected to be 0? explain why or why not? f. test the estimated coefficient b for statistical significance. if the dealership decreases its hours of operation by 10%, what is the expected impact on daily sales?
Answers: 2
Do you know the correct answer?
Catherine is a making a gift container in the shape of a square pyramid. one of the side of the squa...
Questions in other subjects:

Mathematics, 05.11.2020 19:30
Mathematics, 05.11.2020 19:30

History, 05.11.2020 19:30

Mathematics, 05.11.2020 19:30
Mathematics, 05.11.2020 19:30


