

Mathematics, 30.06.2019 15:30, shy88
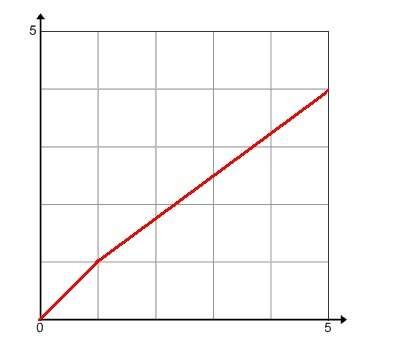
Which scenario is best represented by the graph? a. jamie left home at 8: 00, stopped for lunch at 9: 00 and then continued her trip. b. jamie began the race by running fast, then slowed down a bit and finished the race at a the slower speed. c. jamie left home and realized she forgot to turn off the lights. she drove back home to turn off the lights and then continued on her trip. d. jamie drove for 1 hour then turned right and continued driving for another hour. she finally turned left and continued driving for the next 4 hours.

Answers: 1


Other questions on the subject: Mathematics
Mathematics, 21.06.2019 13:20, jessicascott120305
If f(x)=2x+2and g(x)=x^3, what is (g•f)(2)
Answers: 1
Mathematics, 21.06.2019 16:00, ericavasquez824
The graph shows the distance y, in inches, a pendulum moves to the right (positive displacement) and to the left (negative displacement), for a given number of seconds x. how many seconds are required for the pendulum to move from its resting position and return? enter your answer in the box.
Answers: 2
Do you know the correct answer?
Which scenario is best represented by the graph? a. jamie left home at 8: 00, stopped for lunch at...
Questions in other subjects:
Mathematics, 11.10.2019 04:00

Social Studies, 11.10.2019 04:00
Mathematics, 11.10.2019 04:00
Mathematics, 11.10.2019 04:00

Geography, 11.10.2019 04:00

Biology, 11.10.2019 04:00


