

Mathematics, 03.07.2019 22:00, seoulux
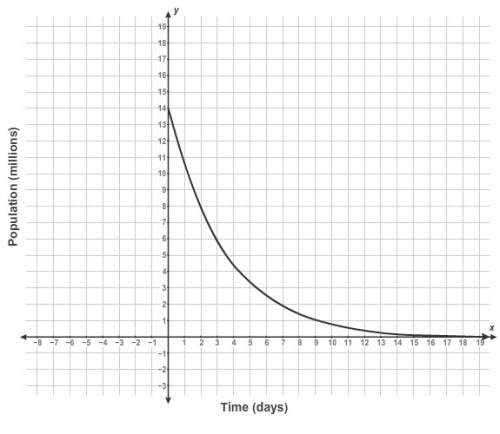
The graph shows a bacteria population as a function of the number of days since an antibiotic was introduced. how many bacteria were present when the antibiotic was first introduced? enter your answer in the box.

Answers: 2


Other questions on the subject: Mathematics
Mathematics, 21.06.2019 16:00, hopeR13
Elena and her husband marc both drive to work. elena's car has a current mileage (total distance driven) of 15,000 and she drives 23,000 miles more each year. marc's car has a current mileage of 46,000 and he drives 9,000 miles more each year. will the mileages for the two cars ever be equal? explain.
Answers: 2
Mathematics, 21.06.2019 16:30, ezapata21
You are making a battery for a science project. you have copper wire for your first electrode. you need to choose a conductor, a second electrode, and a device to plug into your battery. you have already chosen a lemon conductor. complete each statement below about the options that include a lemon conductor.
Answers: 2
Mathematics, 21.06.2019 23:00, tonimgreen17p6vqjq
Which graph represents the linear function below? y-3=1/2(x+2)
Answers: 2
Do you know the correct answer?
The graph shows a bacteria population as a function of the number of days since an antibiotic was in...
Questions in other subjects:

Spanish, 29.09.2019 21:30


Biology, 29.09.2019 21:30


Mathematics, 29.09.2019 21:30
Biology, 29.09.2019 21:30
Mathematics, 29.09.2019 21:30


