

Mathematics, 06.07.2019 10:00, danniuhrig
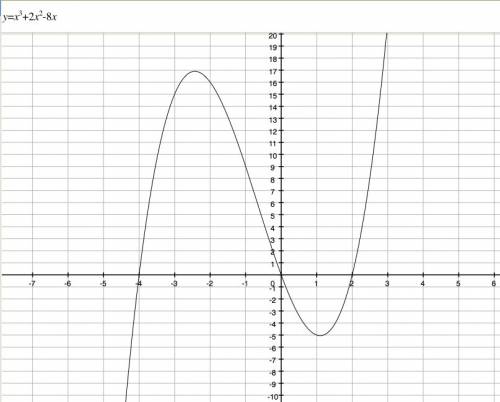
Describing key features of a graph of a polynomial function: explain how to sketch a graph of the function f(x) = x3 + 2x2 – 8x. be sure to include end-behavior, zeroes, and intervals where the function is positive and negative.

Answers: 2


Other questions on the subject: Mathematics
Mathematics, 21.06.2019 18:00, stephanielynch
Last year, a state university received 3,560 applications from boys. of those applications, 35 percent were from boys who lived in other states. part a)how many applications did the university receive from boys who lived in other states? part b)applications to the university from boys represented 40percent of all applications. how many applications did the university receive in all? i don't how to do part b so me and plz tell how you got your answer
Answers: 1
Mathematics, 22.06.2019 03:30, Deemon
Sera sells t-shirts at the beach. she believes the price of a t-shirt and the number of t-shirts sold are related. she has been experimenting with different prices for the t-shirts. she has collected a data set with five pairs of data; each consists of the price of a t-shirt and the number of shirts sold. the independent variable, which will go on the x-axis, is . the dependent variable, which will go on the y-axis, is the
Answers: 3
Do you know the correct answer?
Describing key features of a graph of a polynomial function: explain how to sketch a graph of the f...
Questions in other subjects:

Mathematics, 01.07.2020 15:01
Mathematics, 01.07.2020 15:01

Mathematics, 01.07.2020 15:01

Chemistry, 01.07.2020 15:01


