

Mathematics, 06.07.2019 22:00, joynerjaila
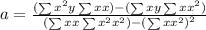
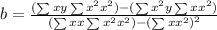
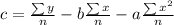
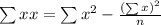
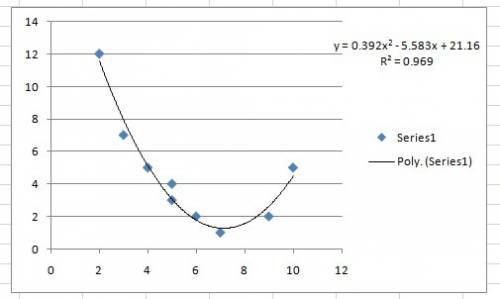
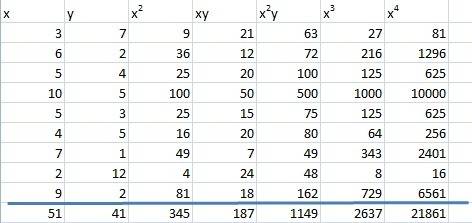
Which equation is the quadratic regression equation for the data shown in the table? x 3 6 5 10 5 4 7 2 9 y 7 2 4 5 3 5 1 12 2 y=3x∧2 + 6x+5 y=0.392x - 5.583x y=0.392x∧2 - 5.583x + 21.167 y= -0.006x∧2 - 0.431x + 0.407

Answers: 1


Other questions on the subject: Mathematics
Mathematics, 21.06.2019 16:00, mncampbell01
Answer asap ! the shortest path from point a to point b goes through a pond. to avoid the pond, you must walk straight 34 meters along one edge of the pond, then take a 90 degree turn, and again walk straight 41 meters along another edge of the pond to reach point b. about how many meters would be saved if it were possible to walk through the pond? a. 11 m b. 20 m c. 30.45 m d. 21.73 m
Answers: 1
Mathematics, 21.06.2019 23:00, ManBun99
Assume that there is a 11% rate of disk drive failure in a year. a. if all your computer data is stored on a hard disk drive with a copy stored on a second hard disk drive, what is the probability that during a year, you can avoid catastrophe with at least one working drive? b. if copies of all your computer data are stored on four independent hard disk drives, what is the probability that during a year, you can avoid catastrophe with at least one working drive?
Answers: 2
Mathematics, 22.06.2019 00:00, bri9263
(20 points) a bank has been receiving complaints from real estate agents that their customers have been waiting too long for mortgage confirmations. the bank prides itself on its mortgage application process and decides to investigate the claims. the bank manager takes a random sample of 20 customers whose mortgage applications have been processed in the last 6 months and finds the following wait times (in days): 5, 7, 22, 4, 12, 9, 9, 14, 3, 6, 5, 15, 10, 17, 12, 10, 9, 4, 10, 13 assume that the random variable x measures the number of days a customer waits for mortgage processing at this bank, and assume that x is normally distributed. 2a. find the sample mean of this data (x ě…). 2b. find the sample variance of x. find the variance of x ě…. for (c), (d), and (e), use the appropriate t-distribution 2c. find the 90% confidence interval for the population mean (îľ). 2d. test the hypothesis that îľ is equal to 7 at the 95% confidence level. (should you do a one-tailed or two-tailed test here? ) 2e. what is the approximate p-value of this hypothesis?
Answers: 2
Do you know the correct answer?
Which equation is the quadratic regression equation for the data shown in the table? x 3 6 5 10 5 4...
Questions in other subjects:

Social Studies, 24.09.2021 03:40
Mathematics, 24.09.2021 03:40


History, 24.09.2021 03:40

Spanish, 24.09.2021 03:40
Mathematics, 24.09.2021 03:40


