

Mathematics, 08.07.2019 10:00, Thelearner100
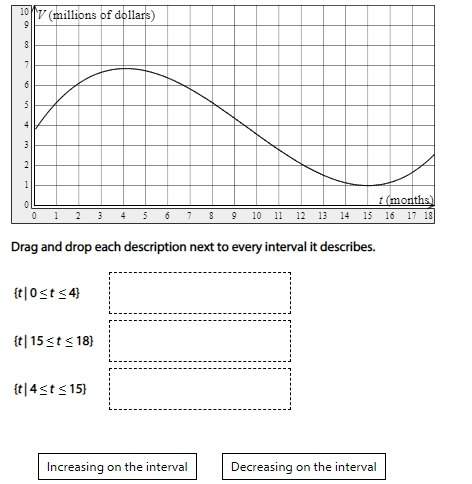
The graph shows a function that models the value v (in millions of dollars) of a stock portfolio as a function of time t (in months) over an 18-month period.

Answers: 1


Other questions on the subject: Mathematics
Mathematics, 21.06.2019 16:00, ccompassimvu
Awall map has a scale of 128 miles = 6 inches. the distance between springfield and lakeview is 2 feet on the map. what is the actual distance between springfield and lakeview? 384 miles 512 miles 1.13 miles 42.7 miles
Answers: 1
Mathematics, 21.06.2019 20:00, rogelionavarro200314
Evaluate the discriminant of each equation. tell how many solutions each equation has and whether the solutions are real or imaginary. x^2 + 4x + 5 = 0
Answers: 2
Mathematics, 21.06.2019 20:40, stotherow5
Describe the symmetry of the figure. identify lines of symmetry, if any. find the angle and the order of any rotational symmetry.
Answers: 1
Mathematics, 22.06.2019 00:30, gthif13211
I've been working on this for a few days and i just don't understand, it's due in a few hours. you. the direction of a vector is defined as the angle of the vector in relation to a horizontal line. as a standard, this angle is measured counterclockwise from the positive x-axis. the direction or angle of v in the diagram is α. part a: how can you use trigonometric ratios to calculate the direction α of a general vector v = < x, y> similar to the diagram? part b suppose that vector v lies in quadrant ii, quadrant iii, or quadrant iv. how can you use trigonometric ratios to calculate the direction (i. e., angle) of the vector in each of these quadrants with respect to the positive x-axis? the angle between the vector and the positive x-axis will be greater than 90 degrees in each case. part c now try a numerical problem. what is the direction of the vector w = < -1, 6 > ?
Answers: 1
Do you know the correct answer?
The graph shows a function that models the value v (in millions of dollars) of a stock portfolio as...
Questions in other subjects:


Chemistry, 26.06.2020 16:01
Mathematics, 26.06.2020 16:01


