

Mathematics, 08.07.2019 18:30, eriks7779
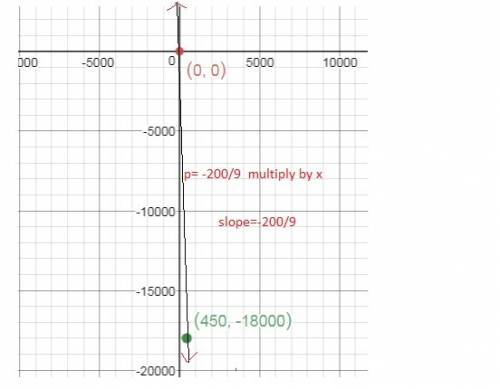
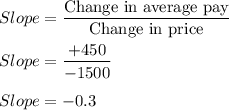
Acompany’s profits (p) are related to increases in a worker’s average pay (x) by a linear equation. if the company’s profits drop by $1,500 per month for every increase of $450 per year in the worker’s average pay, what is the slope of the graph of the equation? pls write the answer on a graph hurry pls -sophia g

Answers: 1


Other questions on the subject: Mathematics
Mathematics, 22.06.2019 00:00, wannaoneisforever
The average length of a king cobra is 3.7 m. the record length is 1.88 m longer than the average. how long is the record holder?
Answers: 1
Mathematics, 22.06.2019 01:40, jraemier5480
Afamily has two cars. the first car has a fuel efficiency of 25 miles per gallon of gas and the second has a fuel efficiency of 15 miles per gallon of gas. during one particular week, the two cars went a combined total of 1025 miles, for a total gas consumption of 55 gallons. how many gallons were consumed by each of the two cars that week?
Answers: 1
Mathematics, 22.06.2019 02:00, mathhelppls14
1. the manager of collins import autos believes the number of cars sold in a day (q) depends on two factors: (1) the number of hours the dealership is open (h) and (2) the number of salespersons working that day (s). after collecting data for two months (53 days), the manager estimates the following log-linear model: q 4 equation 1 a. explain, how to transform the log-linear model into linear form that can be estimated using multiple regression analysis. the computer output for the multiple regression analysis is shown below: q4 table b. how do you interpret coefficients b and c? if the dealership increases the number of salespersons by 20%, what will be the percentage increase in daily sales? c. test the overall model for statistical significance at the 5% significance level. d. what percent of the total variation in daily auto sales is explained by this equation? what could you suggest to increase this percentage? e. test the intercept for statistical significance at the 5% level of significance. if h and s both equal 0, are sales expected to be 0? explain why or why not? f. test the estimated coefficient b for statistical significance. if the dealership decreases its hours of operation by 10%, what is the expected impact on daily sales?
Answers: 2
Do you know the correct answer?
Acompany’s profits (p) are related to increases in a worker’s average pay (x) by a linear equation....
Questions in other subjects:


History, 09.10.2019 17:10

Physics, 09.10.2019 17:10

Biology, 09.10.2019 17:10


