Q1.
f(x)=2.5x - 10.5
f(2)=2.5(2)-10.5 = -5.5
They'll go up by 2.5 from here:
x 2 3 4 5 6
f -5.5 -3.0 -0.5 2.0 4.5
Each subsequent x halves the value. Our table is now
x 2 3 4 5 6
f -5.5 -3.0 -0.5 2.0 4.5
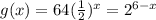
g 16 8 4 2 1
We see they intersect at x=5
x=5
Check:
f(5) = 2.5(5) - 10.5 = 2
g(5) = 64(.5)^5 = 64/32=2 good
Q2.
The total revenue is really the area under those two lines. For print ads that's a trapezoid,

For online ads it's a triangle:

Those are estimated to be exactly the same, so the marketing executive was exaggerating when they said since started the revenue from online is double that from print. A lying marketing exec, imagine that.
They could have truthfully said that currently the revenue from online ads is triple that from print ads, and that trend is increasing.
It looks like around t=7.5, somewhere in the seventh year, the revenues were equal.
Q3.
A. Just looking at the data evenly spaced every five years,
Year 0 5 10 15
West 100 90 80 70
Dunes 20 45 70 95
These each have a common first difference.
For Western we see a decrease of 10 feet every five years, a slope of -2.
For Dunes we see an increase of 25 feet every five years, a slope of 5.
The y intercepts are the initial values so as equations,
w(t) = -2 t + 100
d(t) = 5t + 20
From the graph we see t between 11 and 12 is the meet. Let's solve the equation.
-2t + 100 = 5t + 20
80 = 7 t
t = 80/7 = 11.4...
Answer part B: between years 11 and 12
Answer part C: solve the equation like we did