

Mathematics, 18.07.2019 23:30, harkey
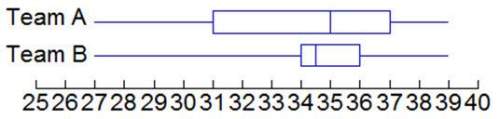
The two box and whisker plots below show the times in seconds for two teams in a 100m dash . what do the interquartile ranges tell you about the two teams? (picture attached)

Answers: 1


Other questions on the subject: Mathematics
Mathematics, 21.06.2019 14:00, janetshirinyan
Which of the following is the missing term, a2, of the geometric sequence in which a1=2 and a3=200
Answers: 2
Mathematics, 21.06.2019 19:30, anniekwilbourne
Powerful women's group has claimed that men and women differ in attitudes about sexual discrimination. a group of 50 men (group 1) and 40 women (group 2) were asked if they thought sexual discrimination is a problem in the united states. of those sampled, 11 of the men and 19 of the women did believe that sexual discrimination is a problem. if the p-value turns out to be 0.035 (which is not the real value in this data set), then at = 0.05, you should fail to reject h0. at = 0.04, you should reject h0. at = 0.03, you should reject h0. none of these would be a correct statement.
Answers: 2
Mathematics, 22.06.2019 00:00, deidaraXneji
Table of values relation g values x, y 2,2 /3,5 /4,9 /5,13 which ordered pair is in g inverse? a(-2,2) b(-3,-5) c)4,9) d( 13,5)
Answers: 3
Do you know the correct answer?
The two box and whisker plots below show the times in seconds for two teams in a 100m dash . what do...
Questions in other subjects:

Mathematics, 14.12.2020 19:20
Mathematics, 14.12.2020 19:20


Computers and Technology, 14.12.2020 19:20
Mathematics, 14.12.2020 19:20


