

Mathematics, 19.07.2019 22:30, candlelight45
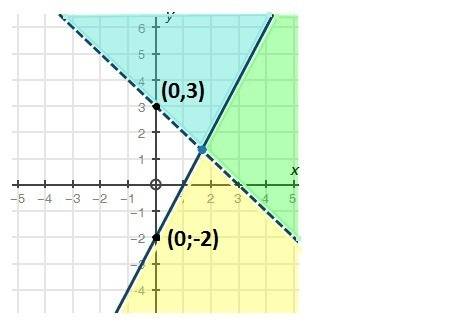
The graph below represents which system of inequalities? option a y > 2x − 3 y > −x − 3 option b y < 2x − 2 y < −x + 3 option c y ≤ 2x − 2 y > −x + 3 option d none of the above

Answers: 1


Similar questions
Do you know the correct answer?
The graph below represents which system of inequalities? option a y > 2x − 3 y > −x − 3 opt...
Questions in other subjects:
Mathematics, 18.02.2020 04:58


Social Studies, 18.02.2020 04:58

Computers and Technology, 18.02.2020 04:58
Mathematics, 18.02.2020 04:58
Mathematics, 18.02.2020 04:58


