

Mathematics, 24.09.2019 02:40, marcusajns
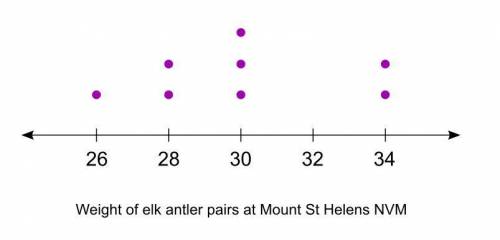
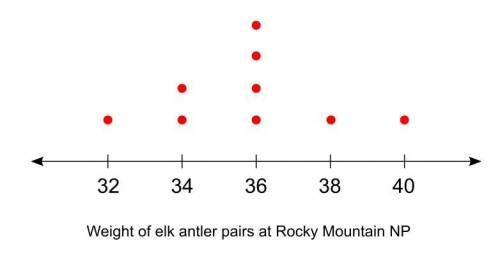
Fast ill make brainiest mr. mcclellan compared the weights (in pounds) of pairs of elk antlers dropped at mount st helens nvm and rocky mountain np. he tabulated them in the following colored data tables. purple: weight of elk antler pairs at mount st helens nvm: {34, 34, 30, 30, 30, 28, 28, 26} red: weight of elk antler pairs at rocky mountain np: {40, 38, 36, 36, 36, 36, 34, 32}
(a) create a line plot for each data set.
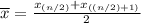
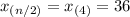
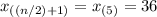
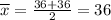
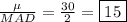
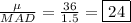
(b) calculate the following for each set of data: a. purple mean: b. red mean: c. purple median: d. red median: e. purple mad: f. red mad:
(c) calculate the means-to-mad ratio for the two areas of collection. (
d) what inference can be made about the areas in regard to weight of dropped elk antlers? explain.

Answers: 1


 has
has 

 has
has 


Other questions on the subject: Mathematics
Mathematics, 21.06.2019 17:20, polarbear3787
Which system of linear inequalities is represented by the graph? x-3y > 6 and y? 2x + 4 x + 3y > 6 and y? 2x - 4 x - 3y > 6 and y? 2 - 4 x + 3y > 6 and y > 2x + 4 no be 2 -1.1 1 2 3 4 5 submit save and exit next mark this and retum be
Answers: 1
Mathematics, 21.06.2019 21:20, madisontrosclair2
Amajor grocery store chain is trying to cut down on waste. currently, they get peaches from two different distributors, whole fruits and green grocer. out of a two large shipments, the manager randomly selects items from both suppliers and counts the number of items that are not sell-able due to bruising, disease or other problems. she then makes a confidence interval. is there a significant difference in the quality of the peaches between the two distributors? 95% ci for pw-pg: (0.064, 0.156)
Answers: 3
Do you know the correct answer?
Fast ill make brainiest mr. mcclellan compared the weights (in pounds) of pairs of elk antlers dropp...
Questions in other subjects:
Mathematics, 03.05.2021 18:00


Mathematics, 03.05.2021 18:00
Mathematics, 03.05.2021 18:00


