

History, 17.06.2021 22:30, 0Brittany0
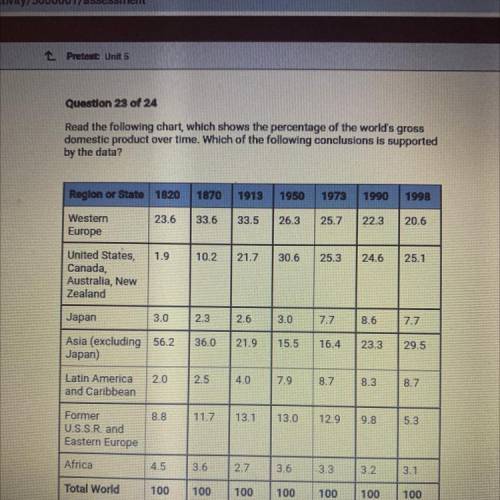
Read the following chart, which shows the percentage of the world's gross
domestic product over time. Which of the following conclusions is supported
by the data?
Region or State 1820
1870
1913
1950
1973
1990
1998
23.6
33.6
33.5
26.3
25.7
22.3
20.6
Western
Europe
1.9
10.2
21.7
30.6
25.3
24.6
25.1
United States,
Canada,
Australia, New
Zealand
Japan
3.0
2.3
2.6
3.0
7.7
8.6
7.7
36.0
21.9
15.5
16.4
23.3
29.5
Asia (excluding 56.2
Japan)
2.0
2.5
4.0
7.9
8.7
8.3
8.7
Latin America
and Caribbean
8.8
11.7
13.1
13.0
12.9
9.8
5.3
Former
U. S.S. R. and
Eastern Europe
Africa
4.5
3.6
2.7
3.6
.3.3
3.2
3.1
Total World
100
100
100
100
100
100
100

Answers: 2


Other questions on the subject: History
History, 21.06.2019 14:40, karatekats1
How did industrialization change life in the united states?
Answers: 1
History, 21.06.2019 23:00, alyssaarnold230
How does the pyramid of giza include art, science, math, or a need for infrastructure?
Answers: 1
History, 22.06.2019 00:00, oliviaberta91
The articles of confederation did not allow the government the power to tax or to force the states to do anything. what challenges could this cause
Answers: 1
Do you know the correct answer?
Read the following chart, which shows the percentage of the world's gross
domestic product over tim...
Questions in other subjects:

Mathematics, 27.04.2021 20:20
Mathematics, 27.04.2021 20:20
Mathematics, 27.04.2021 20:20


History, 27.04.2021 20:20


