History, 23.05.2021 02:20, deonharris18
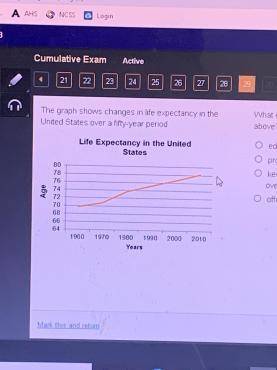
The graph shows changes in life expectancy in the United States over a fifty-year period.
A line graph titled Life Expectancy in the United States shows years on the x axis and age on the y axis. The line starts at 70 in 1960, to 71 in 1970, 74 in 1980, 75 in 1990, 76 in 2000, to 78 in 2010.
What challenge arose as a result of the trend shown above?
A. educating millions of school-age children
B. providing medical care for an aging population
C. keeping people from leaving the country to retire overseas
D. offering easy-to-follow voting registration procedures


Answers: 3
Other questions on the subject: History


History, 22.06.2019 02:00, bearbri4520
Me and youin the summer of 1804, after meeting native americans for the first time, lewis and clark reached the eastern edge of
Answers: 1

History, 22.06.2019 04:30, chloerojassbusiness
This primary document offers information about which aspect of colonial culture
Answers: 3

History, 22.06.2019 15:50, naomicervero
Which of the following is the correct order of key events in the sioux conflicts? (1) red cloud’s war (2) treaty of fort laramie (3) black hills gold rush (4) battle of little bighorn (1) treaty of fort laramie (2) battle of little bighorn (3) red cloud’s war (4) black hills gold rush (1) black hills gold rush (2) red cloud’s war (3) battle of little bighorn (4) treaty of fort laramie (1) battle of little bighorn (2) treaty of fort laramie (3) black hills gold rush (4) red cloud’s war
Answers: 1
Do you know the correct answer?
The graph shows changes in life expectancy in the United States over a fifty-year period.
A line gr...
Questions in other subjects:


History, 08.12.2021 20:10


Chemistry, 08.12.2021 20:10


History, 08.12.2021 20:10


