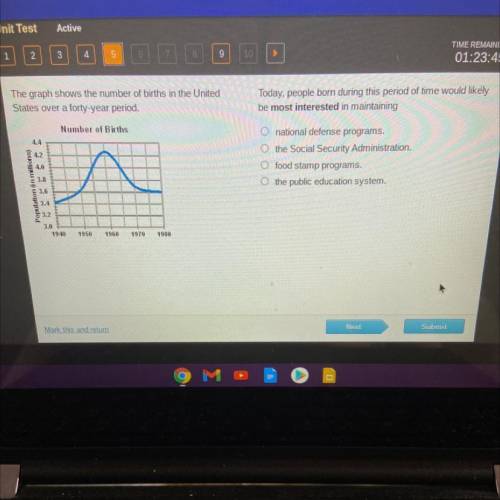
The graph shows the number of births in the United
States over a forty-year period.
Today, p...

History, 27.04.2021 21:20, janneemanoeee
The graph shows the number of births in the United
States over a forty-year period.
Today, people born during this period of time would likely
be most interested in maintaining
Number of Births
4.4
4.2
O national defense programs.
O the Social Security Administration.
O food stamp programs.
o the public education system.
4.0
Population in millions)
3.8
3.6
3.4
3.2
3.0
1940
1950
1960
1970
1980


Answers: 3
Other questions on the subject: History


History, 22.06.2019 01:00, bbrogle4070
Which of the following groups was from new york but felt ostracized by their neighbors because of their religious beliefs? question 40 options: irish catholics germans chinese immigrants mormons
Answers: 1


History, 22.06.2019 05:30, isabellamason5900
Afeature that an organism __ and reproduce in its environment is called a
Answers: 1
Do you know the correct answer?
Questions in other subjects:

Chemistry, 30.01.2020 06:05


Mathematics, 30.01.2020 06:43

English, 30.01.2020 06:43


Social Studies, 30.01.2020 06:43


Mathematics, 30.01.2020 06:43


