

History, 19.04.2021 14:00, rleiphart1
Refer to the graph.
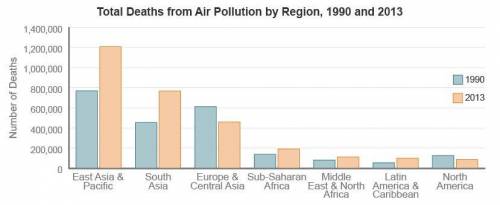
A graph titled Total Deaths from Air Pollution by Region, 1990 and 2013 shows regions on the x axis and number of deaths on the y axis. The graph shows an upward trend from years 1990 to 2013 for East Asia and the Pacific.
What was most likely the cause for the change between 1990 and 2013 in the East Asia and Pacific region?
North Korea built new high-polluting, coal-fueled power plants.
China experienced rapid industrial and urban population growth.
Japan reduced government regulation of industrial environmental practices.
Mongolia increased global commercial exports after joining the World Trade Organization.

Answers: 1


Other questions on the subject: History
History, 21.06.2019 17:00, brodycruce
Need on these last 2 questions on my social studies homework 5 and 6 then i’m done with the homework
Answers: 3
Do you know the correct answer?
Refer to the graph.
A graph titled Total Deaths from Air Pollution by Region, 1990 and 2013 shows r...
Questions in other subjects:

Biology, 04.11.2021 18:10

Mathematics, 04.11.2021 18:10
Biology, 04.11.2021 18:10

Mathematics, 04.11.2021 18:10


Physics, 04.11.2021 18:10


