


17. The chart indicates a shift in population.
Which set of data could be linked with the
phe...

17. The chart indicates a shift in population.
Which set of data could be linked with the
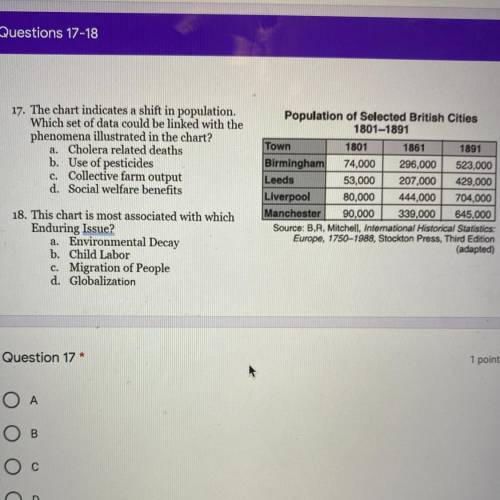
phenomena illustrated in the chart?
a. Cholera related deaths
b. Use of pesticides
c. Collective farm output
d. Social welfare benefits
Population of Selected British Cities
1801-1891
Town
1801 1861 1891
Birmingham 74,000 296,000 523,000
Leeds
53,000 207,000 429,000
Liverpool 80,000 444,000 704,000
Manchester 90,000 339,000 645,000
Source: B. R, Mitchell, International Historical Statistics:
Europo, 1750-1988, Stockton Press, Third Edition
(adapted)
18. This chart is most associated with which
Enduring Issue?
a. Environmental Decay
b. Child Labor
c. Migration of People
d. Globalization

Answers: 2
Other questions on the subject: History
History, 22.06.2019 05:30, RoxanneDuartee
Who coined the phrase “go west and grow with the country”?
Answers: 1
History, 22.06.2019 11:00, babycakez143
What terms did the treaty of versailles place on germany
Answers: 3
History, 22.06.2019 14:30, 22nathanieltimms
According to the supreme court's decision in mcculloh v. maryland, how does th constitution differ from the articles of confederation
Answers: 1
Do you know the correct answer?
Questions in other subjects:


Mathematics, 25.07.2019 07:10
Spanish, 25.07.2019 07:10
Mathematics, 25.07.2019 07:10

Social Studies, 25.07.2019 07:10

Mathematics, 25.07.2019 07:10
Mathematics, 25.07.2019 07:10


