

History, 07.12.2020 22:00, lindseybug
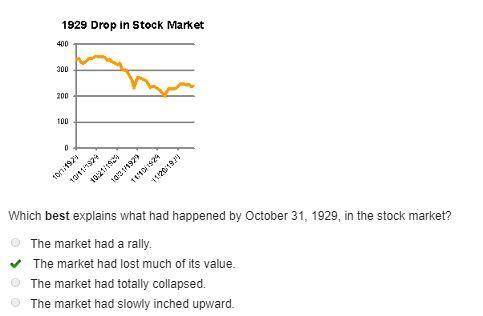
Look at the graph. Then answer the question. A graph titled 1929 Drop in Stock Market. The x axis shows dates from October 1, 1929 to November 20, 1929. The y axis shows the stock market average, from 0 to 400. On October 1, the market was around 350. It stayed steady through October 11, fell to 320 on October 21, fell to 220 by October 31, then fell to 200 after November 10, before rising to 250 on November 20. Which best explains what had happened by October 31, 1929, in the stock market? The market had a rally. The market had lost much of its value. The market had totally collapsed. The market had slowly inched upward.

Answers: 1


Other questions on the subject: History
History, 21.06.2019 15:00, cardonaalfredo
One of the main problems with the indian reservation system was that government agents took land from settlers to give to american indians. dealt dishonestly with american indian families. did not understand the power structure of american indian tribes. gave land to settlers who removed american indians.
Answers: 2
History, 22.06.2019 01:00, bbrogle4070
Which of the following groups was from new york but felt ostracized by their neighbors because of their religious beliefs? question 40 options: irish catholics germans chinese immigrants mormons
Answers: 1
History, 22.06.2019 05:20, raymondanthony3314
What type of monarch was fredrick the great ?
Answers: 1
Do you know the correct answer?
Look at the graph. Then answer the question. A graph titled 1929 Drop in Stock Market. The x axis sh...
Questions in other subjects:


Arts, 09.03.2021 14:40


Physics, 09.03.2021 14:40
Mathematics, 09.03.2021 14:40

French, 09.03.2021 14:40
History, 09.03.2021 14:40


