

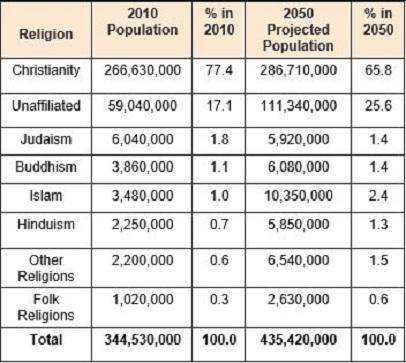
Examine the chart. A 5-column table with 9 rows titled Religion in North America. Column 1 is titled Religion with entries Christianity, Unaffiliated, Judaism, Buddhism, Islam, Hinduism, Other Religions, Folk Regions, and Total. Column 2 is titled 2010 population with entries 266,630,000; 59,040,000; 6,040,000; 3,860,000; 3,480,000; 2,250,000; 2,200,000, 1,020,000; and 344,530,000. Column 3 is titled percent in 2010 with entries 77.4, 17.1, 1.8, 1.1, 1.0, 0.7, 0.6, 0.3, and 100.0. Column 4 is titled 2050 Projected Population with entries 286,710,000; 111,340,000; 5,920,000; 6,080,000; 10,350,000; 5,850,000; 6,540,000; 2,630,000; and 435,420,000. Column 5 is titled percent in 2050 with entries 65.8, 25.6, 1.4, 1.4, 2.4, 1.3, 1.5, 0.6, and 100.0. Which conclusion can be drawn from the data presented in the chart? By 2050, there will be fewer Christians in North America than there were in 2010. There will still be fewer North Americans practicing Islam than Judaism or Buddhism in 2050. The number of North Americans who are unaffiliated with any religion will increase significantly by 2050. All religions except Christianity will represent a greater percentage of North Americans in 2050 than in 2010.

Answers: 3


Other questions on the subject: History
History, 22.06.2019 05:40, lovelarissa
How did the mexcian war of independence differ from the american revolution?
Answers: 1
History, 22.06.2019 14:10, memberpabc
100 53. how have developed western countries affected non-western developing nations during the modern period? explain how three political, economic, and/or cultural approaches by european and other western countries shaped the developing world over the last 250 years. use examples from your studies to support your ideas and opinions.
Answers: 1
History, 22.06.2019 16:30, william03300
Asap study the map above. summarize the data shown on the map, and explain its significance relative to international events in 2007. what is the push factor? answer the following questions: what is the total number of people displaced within iraq? what is the total number of people who have migrated outside of iraq? have most refugees remained within the region or traveled abroad? to what country have most refugees within the region gone? identify three potential effects of the refugees on the destination countries. identify two potential pull factors that might induce them to return to iraq.
Answers: 3
Do you know the correct answer?
Examine the chart. A 5-column table with 9 rows titled Religion in North America. Column 1 is titled...
Questions in other subjects:

Mathematics, 29.09.2019 00:30

Mathematics, 29.09.2019 00:30
History, 29.09.2019 00:30


Computers and Technology, 29.09.2019 00:30
Mathematics, 29.09.2019 00:30
History, 29.09.2019 00:30


