


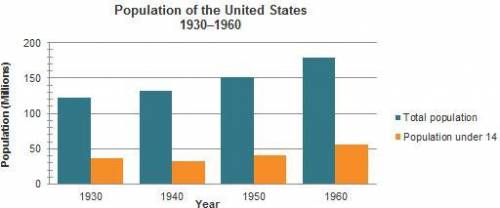
The graph shows US population figures from 1930 to 1960.
What would most likely result fr...

History, 05.05.2020 13:30, AnimeGurlBYah
The graph shows US population figures from 1930 to 1960.
What would most likely result from the population change shown on this graph?
A. More medical services would be needed for the aging population.
B. More schools would need to be built for the younger population.
C. Fewer hospitals would need to be built due to the declining population.
D. Fewer workers would be competing for jobs due to the declining population.

Answers: 1
Other questions on the subject: History
History, 21.06.2019 20:30, nancylagunas805
Explain the importance of president harry truman's order to integrate the u. s. military and the federal government.
Answers: 1
History, 22.06.2019 02:30, graycelynn123
Who was the first explorer to sail all the way down the mississippi river
Answers: 2
History, 22.06.2019 07:00, Serenitybella
What was a northern objection to the kansas-nebraska act?
Answers: 3
Do you know the correct answer?
Questions in other subjects:


Chemistry, 24.06.2021 21:50


Computers and Technology, 24.06.2021 21:50
Mathematics, 24.06.2021 21:50
Computers and Technology, 24.06.2021 21:50


