

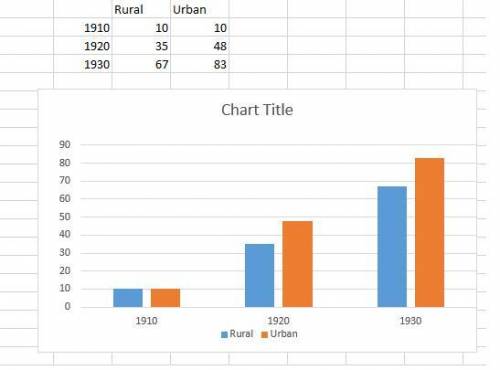
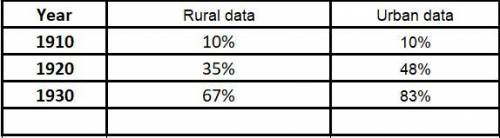
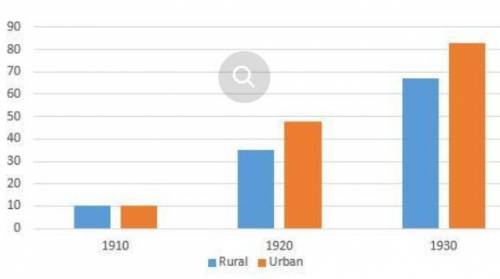
Percentage of US Homes with Electricity A bar graph titled Percentage of U S Homes with Electricity. The x axis shows the years 1910, 1920, 1930. The y axis shows the percentage of homes, from 0 to 90. For all homes: 1910, 10%; 1920, 35%; 1930, 67%. For urban homes: 1910, 10%; 1920, 48%; 1930, 83%. Which statement is supported by information presented in the chart? People owned fewer electrical appliances in the 1920s than in earlier decades. More rural homes than urban homes had access to electricity in the 1920s. The number of houses with electricity would decrease after the 1930s. Demand for electricity increased in the 1920s and 1930s.

Answers: 2


Other questions on the subject: History
History, 22.06.2019 16:30, evelynnn511
Four accomplishments ferdinand and isabella achieved were:
Answers: 1
Do you know the correct answer?
Percentage of US Homes with Electricity A bar graph titled Percentage of U S Homes with Electricity....
Questions in other subjects:

Mathematics, 08.07.2019 03:10
Mathematics, 08.07.2019 03:10
History, 08.07.2019 03:10
Mathematics, 08.07.2019 03:10


