


Which of the following might you infer from the chart?
cotton was a scarcity in the 189...

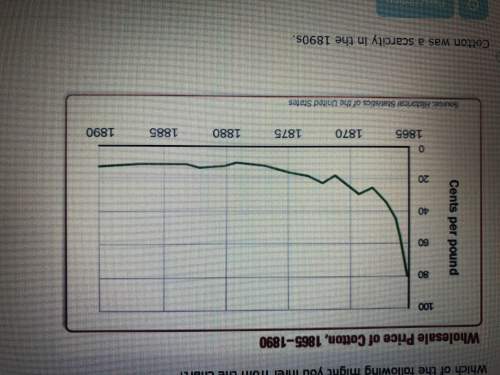
Which of the following might you infer from the chart?
cotton was a scarcity in the 1890s.
cotton production was at an all-time high in 1865.
the economy in the south relied solely on cotton production in the 1890s.
the profitability of cotton farming was decreasing in the late 1800s.

Answers: 2
Other questions on the subject: History
Do you know the correct answer?
Questions in other subjects:


Mathematics, 13.08.2020 22:01
Mathematics, 13.08.2020 22:01
History, 13.08.2020 22:01
Mathematics, 13.08.2020 22:01
Mathematics, 13.08.2020 22:01


