

Geography, 30.08.2021 17:30, adiboo2004
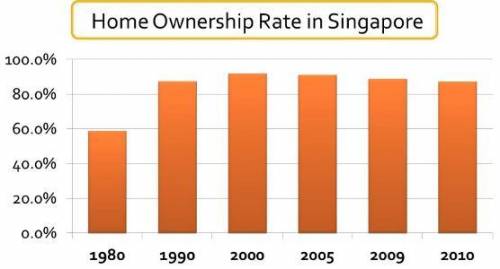
Analyze the graph below and answer the question that follows. A bar graph titled Home Ownership Rate in Singapore. The x-axis is labeled 1980, 1990, 2000, 2005, 2009, and 2010. The y-axis is labeled from 0 percent to 100 percent by 20. 1980 is under 60 percent. 1990 to 2010 is over 80 percent. Data from Department of Statistics Singapore Assuming Singapore's population is constant, what can be inferred about Singapore's home ownership rate from the chart above? A. There were more homeowners in 2009 than in 2000. B. There were more homeowners in 2010 than in 1980. C. There were less homeowners in 2005 than in 2009. D. There were more homeowners in 1980 than in 1990. Please select the best answer from the choices provided A B C D on edge 2021 quiz part 1 of 10

Answers: 3


Other questions on the subject: Geography
Geography, 23.06.2019 07:30, Yeetadab1974
Which was not a country that massively built up its navy in the early 1900s? germany china united statesbritain
Answers: 1
Geography, 23.06.2019 07:40, robertss403
Which of the following types of nonrenewable fuel sources requires the storage of radioactive waste? a. coal b. nuclear c. solar d. oil
Answers: 1
Geography, 23.06.2019 20:40, cheerthi16
By locating production facilities abroad, multinational corporations must pay more for labor true or false
Answers: 1
Geography, 24.06.2019 12:30, coryowens44
Gains you more knowledge intensify your soft skills strong ethics and grows your network
Answers: 1
Do you know the correct answer?
Analyze the graph below and answer the question that follows. A bar graph titled Home Ownership Rate...
Questions in other subjects:


English, 17.07.2019 01:00


Mathematics, 17.07.2019 01:00
English, 17.07.2019 01:00
Mathematics, 17.07.2019 01:00


