

Geography, 28.06.2021 18:40, tiwaribianca475
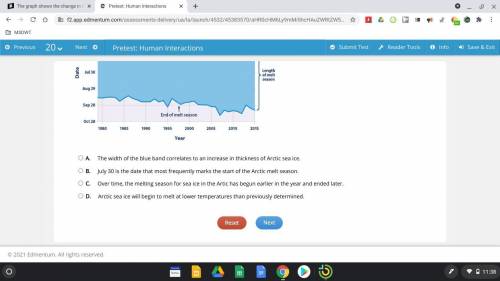
The graph shows the change in the duration of the sea-ice melt season in the Arctic from 1980 to 2015. The blue band represents the time between when ice began to melt and when it froze each year. Which conclusion can you draw from the graph?
A.
The width of the blue band correlates to an increase in thickness of Arctic sea ice.
B.
July 30 is the date that most frequently marks the start of the Arctic melt season.
C.
Over time, the melting season for sea ice in the Artic has begun earlier in the year and ended later.
D.
Arctic sea ice will begin to melt at lower temperatures than previously determined.

Answers: 2


Other questions on the subject: Geography
Geography, 22.06.2019 21:30, htahir2345
In which area will soil formation be greatest? a a steep slope in a warm, b wet climate a flat area in a warm, c wet climate a north-facing area on a steep slope a flat area in a cold, d wet climate description
Answers: 2
Geography, 23.06.2019 01:40, sarahhope55
Macbeth and lady macbeth are partners in the nurder of duncan and both become
Answers: 2
Do you know the correct answer?
The graph shows the change in the duration of the sea-ice melt season in the Arctic from 1980 to 201...
Questions in other subjects:


Social Studies, 04.04.2021 02:30
Mathematics, 04.04.2021 02:30


