

Geography, 18.05.2021 23:20, bettybales1986
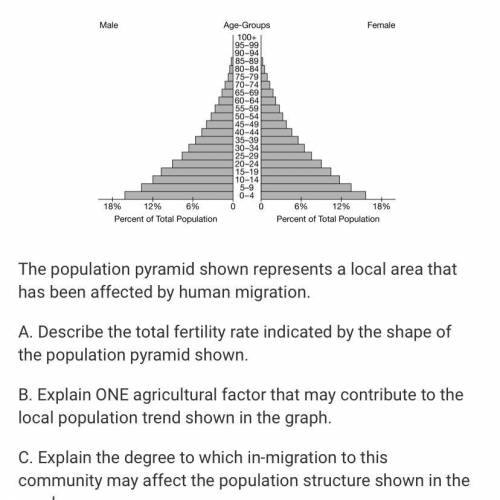
Describe the total fertility rate indicated by the shape of the population pyramid shown.
Explain ONE agricultural factor that may contribute to the local population trend shown in the graph.
Explain the degree to which in-migration to this community may affect the population structure shown in the graph.
Explain a possible outcome regarding future higher-education demand based on the population pyramid shown.

Answers: 3


Other questions on the subject: Geography
Do you know the correct answer?
Describe the total fertility rate indicated by the shape of the population pyramid shown.
Explain O...
Questions in other subjects:


Computers and Technology, 25.02.2020 00:07


Mathematics, 25.02.2020 00:07


