

Geography, 17.10.2020 05:01, mamabates181981
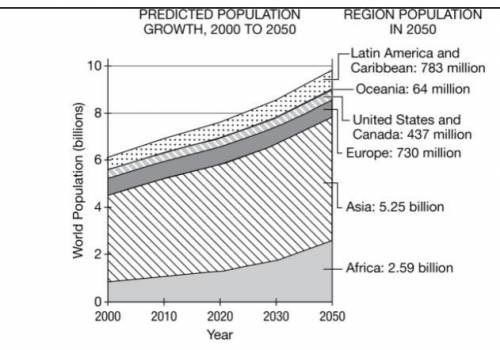
Based on the graph, predicted population growth in which of the following regions is explained by a high total fertility rate? Please help me The answer choices are the countries depicted in the graph.

Answers: 3


Other questions on the subject: Geography
Geography, 24.06.2019 05:00, orangeicecream
What is the process that powers plate tectonics
Answers: 1
Geography, 24.06.2019 16:00, manyah6189
Land cool more quickly than water. as a result the pressure over the water is lower than that over the land, and the air moves from the land to the water. what is this known as. a) prevailing winds b) sea breexes c) land breezes d) valley breezes
Answers: 1
Geography, 24.06.2019 18:20, juana18
Poling our way along the inky green waterway, we glided upstream through quiet still-water bends in the river, where mats of fragrant white flowers had gathered, closing behind the stern of our 24-inch-wide dugout and concealing any sign of our passage. —eric hansen, stranger in the forest: on foot across borneo, 1998 which of these items in the passage is an example of borneo’s flora? a. “the inky green waterway” c. “mats of fragrant white flowers” b. “still-water bends in the river” d. “the stern of our 24-inch-wide dugout”
Answers: 2
Do you know the correct answer?
Based on the graph, predicted population growth in which of the following regions is explained by a...
Questions in other subjects:

Mathematics, 17.04.2020 18:21


Chemistry, 17.04.2020 18:21


