

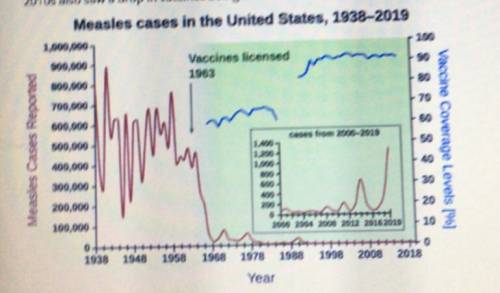
Measles is a disease that causes fever and rash. The graph gives the number of measles cases in the United States between 1938 and 2019
(measured in 100,000s.) The smaller graph shows recent outbreaks (measured in 200s.) The measles vaccine was introduced in the 1960s. The
2010s also saw a drop in vaccines being taken the United States. What can you conclude using the information in the graph?
A) Measles is the leading cause a fever for children under age 5 in the United States.
B) visitors who are not vaccinated continue to spread measles in the United States.
C) The measles vaccine had little effect on the population of the United States.
D) The measles vaccine nearly eliminated measles in the United States him.

Answers: 2


Other questions on the subject: Geography
Geography, 22.06.2019 02:50, Isaiahtate053
In what ways have the people of the netherlands changed the physical geography of their land
Answers: 3
Geography, 24.06.2019 01:30, kprincess16r
The kind of wood most often used in contemporary furniture is
Answers: 3
Do you know the correct answer?
Measles is a disease that causes fever and rash. The graph gives the number of measles cases in the...
Questions in other subjects:


Mathematics, 19.10.2021 14:00


