

Geography, 29.06.2020 23:01, ruthbarrera03p33d7n
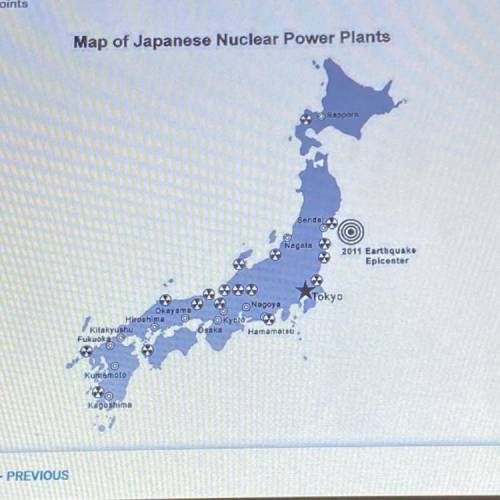
How did the power plants on the map increase the danger of damage and risk
to human life after the March 2011 earthquake?
A. They caused controversy that prevented getting international help.
B. They melted down and leaked radiation into the ground and the air.
C. They used up the financial resources that might otherwise have
gone for repairs.
D. They generated more electricity than could be used when daily
activities stopped.

Answers: 1


Other questions on the subject: Geography
Geography, 22.06.2019 08:30, robert7248
Which of the following is typically not a characteristic of a foraging society? a. foraging societies are nomadic groups. b. foraging societies consist of small groups with ties based on kinship. c. individuals in foraging societies have few personal possessions. d. foraging societies have formal social and class structures
Answers: 3
Geography, 22.06.2019 20:00, TheBurntToast
What events caused the united states to intervene in southwest asia?
Answers: 1
Geography, 23.06.2019 14:20, AdityaMathur
Based on what you know about the location of the earth in relation to the sun, why is this called the goldilocks zone in other galaxies? a. it's a region that exhibits a weak gravitational pull, thus maintaining a safe distance from the sun. b. it's an area that doesn't experience any major weather events that could cause mass extinctions. c. it's an area that's an optimal distance from the sun for potentially supporting life. d. it's a region that's unaffected by asteroid or meteor impacts.
Answers: 3
Geography, 24.06.2019 09:40, nicoleskertich
The hypothetical island country of gilder lies in the mediterranean sea off the coast of france. demographers have studied gilder for the past 50 years. at the beginning of the study, gilder had a population of 20 million. the demographers have measured birth and death numbers, as well as immigration and emigration numbers, as shown in the data table. from the data, calculate the population of gilder for each 10-year period by filling in the population (no) and population (nt) columns in the data table. use this formula to do your calculations: population size: nt = no + (b + i) – (d + e)initial population = 20,000,000
Answers: 2
Do you know the correct answer?
How did the power plants on the map increase the danger of damage and risk
to human life after the...
Questions in other subjects:


Mathematics, 26.08.2019 17:00
Mathematics, 26.08.2019 17:00


Geography, 26.08.2019 17:00

Business, 26.08.2019 17:00


