


Study the graph showing urban and rural population of the world 1950–2050.
Your task is to ann...

Geography, 05.05.2020 02:05, Candieboo6939
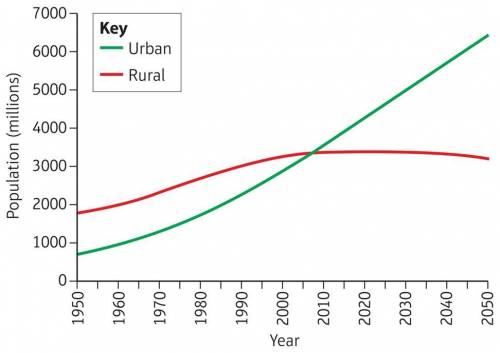
Study the graph showing urban and rural population of the world 1950–2050.
Your task is to annotate the graph, showing any interesting details or trends you can see.
Remember that ‘annotate’ means ‘to add notes and explanations to a map, photograph or diagram’.

Answers: 2
Other questions on the subject: Geography
Geography, 22.06.2019 19:00, letsgivepece2309
City 24-hr average yearly temperature in ºc total yearly precipitation in mm minsk, belarus (former ussr) (53° n, 27° e) shanghai, china (31° n, 121° e) baltimore city, usa (39° n, 76° w) helsinki, finland (60° n, 24° e) banff, canada (51° n, 115° w) kuala lumpur, malaysia (3° n 101° e) 26.5 2393.6 buenos aires, argentina (34° s, 58° w) jakarta, indonesia (6° s, 106° e) questions 1. what factor contributes most to the warm climate of kuala lumpur? 2. banff and minsk are located at similar latitudes. what could account for banff’s average yearly temperature being lower than minsk’s? 3. which city’s climate is most similar to jakarta, baltimore or kuala lumpur? explain your answer. 4. shanghai and buenos aires have located thousands of miles apart and in different hemispheres, yet their climates are similar. what reasoning could explain this?
Answers: 1
Geography, 23.06.2019 11:20, breezyalanah
You have been tasked with sorting the rock samples shown into three categories, with two rocks in each category. what attribute would you use to sort these rocks? which rocks would be in each category? rocks: obsidian, coquina limestone, granite, soapstone, pumice, and gneiss.
Answers: 2
Do you know the correct answer?
Questions in other subjects:


Biology, 15.01.2020 22:31
English, 15.01.2020 22:31


History, 15.01.2020 22:31


