

Geography, 09.10.2019 19:10, edfwef5024
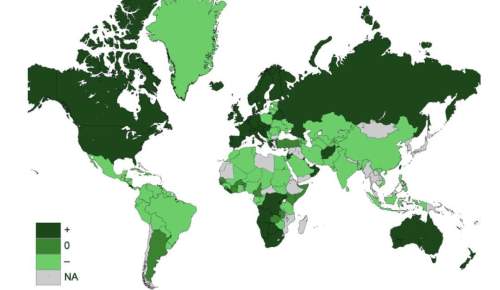
The following map shows net migration rates throughout the world in 2008. why are the net migrations positive in western europe and negative in eastern europe?
political map showing net migration rates throughout the world in 2008. colors show the migration rates in countries. orange countries have a negative rate, green have a zero rate, and blue have a positive rate. the united states and western europe are primarily blue.
a. forced migration in eastern europe
b. higher wages in western europe
c. more factories and industry in western europe
d. better education and cultural opportunities in western europe

Answers: 1


Other questions on the subject: Geography
Geography, 22.06.2019 10:30, myalee1419
What is the result of the greenhouse effect? a. heat is deflected from the atmosphere. b. heat is released from the atmosphere. c. heat is kept in the atmosphere. d. plants are able to grow in the tropics where the air is the heaviest.
Answers: 2
Do you know the correct answer?
The following map shows net migration rates throughout the world in 2008. why are the net migrations...
Questions in other subjects:


Mathematics, 12.03.2020 22:49

Mathematics, 12.03.2020 22:49


Arts, 12.03.2020 22:50

Biology, 12.03.2020 22:50


