

English, 08.06.2021 03:30, harding6698
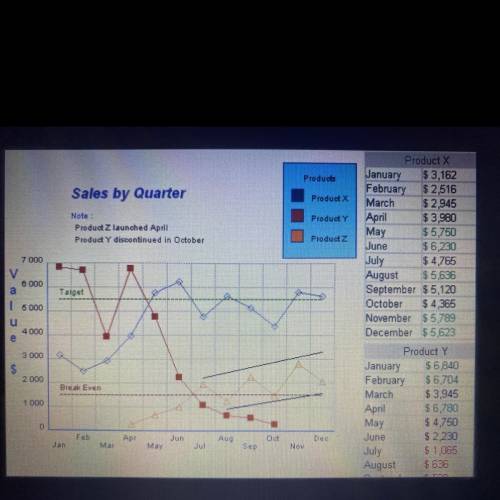
The graph shows product sales for each month during the year of 2018 suppose that product X sales remain above target levels in January 2019 which prediction is most reasonable for January 2019?
A sales of product why will exceed those of product Z
B sales of product Z fall below the breakeven level
C sales of product why will exceed the break even level
D sales of product zero remain above the breakeven level

Answers: 1


Other questions on the subject: English
English, 21.06.2019 19:10, olivernolasco23
Tell whomever you meet about this new opportunity. the bolded words are what kind of clause?
Answers: 2
Do you know the correct answer?
The graph shows product sales for each month during the year of 2018 suppose that product X sales re...
Questions in other subjects:

Mathematics, 20.09.2020 05:01
Mathematics, 20.09.2020 05:01
English, 20.09.2020 05:01


