


Please help Finding and Analyzing Your Data
a temperature map of the US
A temperature ma...

Computers and Technology, 12.03.2021 05:40, jaylaa04
Please help Finding and Analyzing Your Data
a temperature map of the US
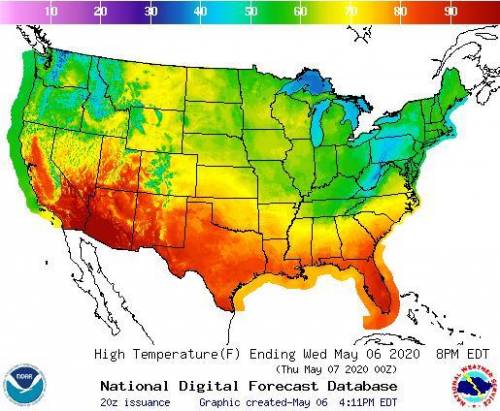
A temperature map of the US (Courtesy of the National Weather Service)
You need a large data set. If you are interested in weather data, try these search prompts. By adding “site:.gov” to your search, you are more likely to find government websites. Be careful in your search to use a trusted and reliable website. You do not want to download a virus along with your data!
climate at a glance site:.gov
statewide time series site:.gov
Examine Your Data
Once you have downloaded data, you will probably need to delete some of the top lines before you read the file. For instance, the following are the top few lines from a file that holds the average February temperature for 126 years. The data lines have three entries: the date, the average February temperature in degrees Fahrenheit, and the departure from the mean February temperature of 33.82 °F. The date is a string composed of the year and month. Since every month is February, all the date strings end in “02.”
Think of what will happen when you read the data in the file. Most of the rows are structured, but the first five rows have identifying information. Be sure you remove such rows from your data file before you process it.
Contiguous U. S., Average Temperature, February
Units: Degrees Fahrenheit
Base Period: 1901-2000
Missing: -99
Date, Value, Anomaly
189502,26.60,-7.22
189602,35.04,1.22
189702,33.39,-0.43
This is how this file should start.
189502,26.60,-7.22
189602,35.04,1.22
189702,33.39,-0.43
Be sure to check your file for the leading lines you need to delete.
Your Task
Now that you have your file holding your data, you need to analyze the data in three different ways that answer questions you pose. How you analyze is up to you, since what you analyze depends on what kind of data you have. As an example, with this data file, you can look for weather trends. You could find the average temperature of each decade, find the decade with the lowest average temperature, and the decade with the highest average temperature. It is a shame that the data table does not go back further. The Krakatoa volcano in Indonesia had a major eruption in 1816. It had such an epic effect on the climate that 1813 was known as the year without a summer.
You need your data file saved in the same folder as your program.
Open your data file with Notepad or Wordpad.
Open a new file in Python.
Copy and paste the contents from Notepad to the Python file.
Save the Python file with a .txt extension in the same folder where you save your program.
Analyzing Your Data
Your program will read your data file, perform the analysis, and write the results to a separate file with a .txt extension.
Write a pseudocode plan for your program. Show your plan to a partner. Ask the partner for any suggestions to improve your plan.
When done, show your results to a partner. Ask your partner what parts they found interesting.
Your Word Document Requirements
Part 1: Name: your name
Part 2: Data Source: the source of your data (do not copy and paste your data into the Word document)
Part 3: Questions to the questions your analysis will answer
Part 4: The Plan: the pseudocode outline of your program
Part 5: Plan Feedback from Your Partner: suggestions from your partner
Part 5: Results: copy and pasted results from your data file
Part 6: Interpretation: your interpretation of the results
Part 7: Final Feedback from Your Partner: description of what your partner found interesting
You can use this rubric
to evaluate your project before you submit it.
What to Submit
You will submit each of the following.
A Word document: Organize it as shown below.
Your data file: Saved with a .txt extension
Your program: Saved with a .txt extension since you cannot upload a .py file.
Your results file: Saved with a .txt extension.

Answers: 3
Other questions on the subject: Computers and Technology
Computers and Technology, 22.06.2019 20:00, jayjay5246
What is the term for water wave that is created by an underwater earthquake
Answers: 1
Computers and Technology, 24.06.2019 06:30, titalili0204
Adrawing that places all lines parallel to the z axis at an angle from the horizon is 99 ! a. an oblique drawing b. a perspective drawing c. an auxiliary view d. a one-point perspective drawing
Answers: 2
Computers and Technology, 25.06.2019 05:00, nathan123498
Arun is 5 years older than anu. five years ago, the ratio of their ages was 3: 2 . find their present age
Answers: 2
Do you know the correct answer?
Questions in other subjects:


Mathematics, 10.10.2019 09:01

Biology, 10.10.2019 09:01
Mathematics, 10.10.2019 09:01

History, 10.10.2019 09:01
History, 10.10.2019 09:01


