Computers and Technology, 10.12.2020 18:40, jaquonb23
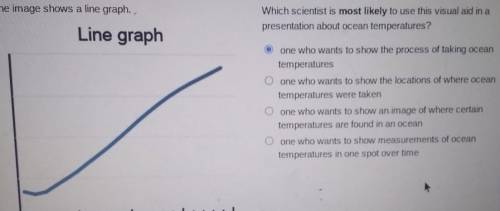
The image shows a line graph. Which scientist is most likely to use this visual aid in a presentation about ocean temperatures? Line graph one who wants to show the process of taking ocean temperatures O one who wants to show the locations of where ocean temperatures were taken O one who wants to show an image of where certain temperatures are found in an ocean O one who wants to show measurements of ocean temperatures in one spot over time


Answers: 2
Other questions on the subject: Computers and Technology

Computers and Technology, 22.06.2019 18:00, deathfire5866
Determine whether the following careers would require training or college.
Answers: 1

Computers and Technology, 23.06.2019 17:00, taytay1828
What are the 12 colors of the spectrum called?
Answers: 1

Computers and Technology, 24.06.2019 19:00, cxttiemsp021
Luis is cloud-based( microsoft bot framework). true false
Answers: 1

Computers and Technology, 24.06.2019 22:00, kingkush85
Difference between ancient and modern mode of information transmission
Answers: 1
Do you know the correct answer?
The image shows a line graph. Which scientist is most likely to use this visual aid in a presentatio...
Questions in other subjects:


Chemistry, 26.11.2020 07:00


Chemistry, 26.11.2020 07:00

Chemistry, 26.11.2020 07:00


Health, 26.11.2020 07:00


