

Based on the table below:
1). create a titration curve of pH vs. volume NaOH in Excel. Indicate on graph the location of each pKa (pka1, pKa2, pKaR) , first and second equivalence point and pI. Show all your calculations.
2). 1st derivative plot of ΔpH / Δvol NaOH an the y-axis and average vol NaOH on the x-axis (graph in Excel). Highlight (label) the equivalence points
- volume of NaOH on maximum inflection point 1 and point 2.
- What pH range(s) would your unknown serve as an effective buffer?
- Identify your unknown
- At what pH does your amino acid carry a net charge of 0? Draw the structure
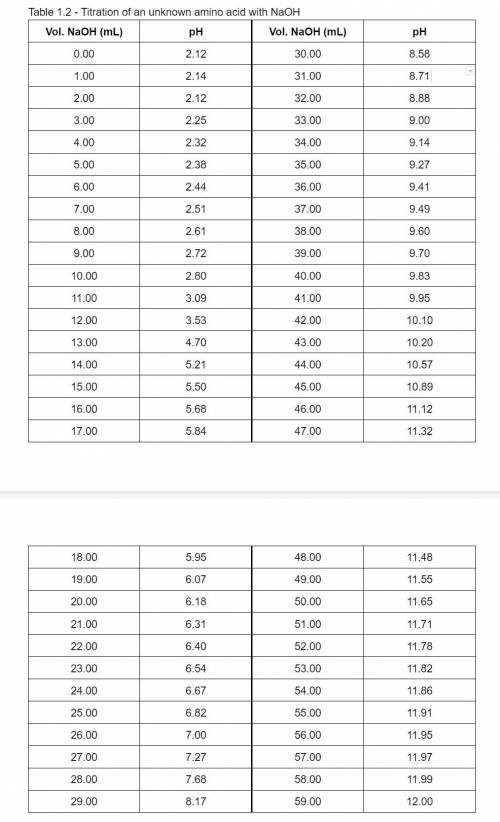
Table 1.2 - Titration of an unknown amino acid with NaOH
Vol. NaOH (mL) pH
0.00 2.12
1.00 2.14
2.00 2.12
3.00 2.25
4.00 2.32
5.00 2.38
6.00 2.44
7.00 2.51
8.00 2.61
9.00 2.72
10.00 2.80
11.00 3.09
12.00 3.53
13.00 4.70
14.00 5.21
15.00 5.50
16.00 5.68
17.00 5.84
18.00 5.95
19.00 6.07
20.00 6.18
21.00 6.31
22.00 6.40
23.00 6.54
24.00 6.67
25.00 6.82
26.00 7.00
27.00 7.27
28.00 7.68
29.00 8.17
30.00 8.58
31.00 8.71
32.00 8.88
33.00 9.00
34.00 9.14
35.00 9.27
36.00 9.41
37.00 9.49
38.00 9.60
39.00 9.70
40.00 9.83
41.00 9.95
42.00 10.10
43.00 10.20
44.00 10.57
45.00 10.89
46.00 11.12
47.00 11.32
48.00 11.48
49.00 11.55
50.00 11.65
51.00 11.71
52.00 11.78
53.00 11.82
54.00 11.86
55.00 11.91
56.00 11.95
57.00 11.97
58.00 11.99
59.00 12.00

Answers: 3


Other questions on the subject: Chemistry
Chemistry, 22.06.2019 11:20, ashiteru123
Which of the following contributes to the structural rigidity of cellulose? adjacent glucose polymers are stabilized by hydrogen bonding. glucose residues are joined by (α1→4) linkages. cellulose is a highly branched molecule. the conformation of the glucose polymer is a coiled structure.
Answers: 2
Chemistry, 22.06.2019 18:00, faithabossard
Which three statements represent the benefits of performing experiments using computer simulations?
Answers: 3
Chemistry, 22.06.2019 20:30, allofthosefruit
Draw a line graph showing the relationship between temperature in kelvin as a function of kinetic energy.
Answers: 3
Do you know the correct answer?
Based on the table below:
1). create a titration curve of pH vs. volume NaOH in Excel. Indicate on...
Questions in other subjects:


Social Studies, 13.01.2021 04:50

Mathematics, 13.01.2021 04:50
Mathematics, 13.01.2021 04:50


Mathematics, 13.01.2021 04:50

Geography, 13.01.2021 04:50
Mathematics, 13.01.2021 04:50


