

Chemistry, 22.07.2021 18:20, parmer6527p810bw
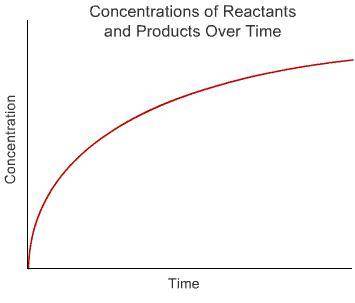
The graph shows the change in concentration of one of the species in the reaction
A + B + C→D.
If the graph indicates the reaction rate, then the concentration of which species is plotted?
A
B
C
D

Answers: 2


Other questions on the subject: Chemistry
Chemistry, 22.06.2019 05:00, happy121906
Which position represents spring in the southern hemisphere? a) b) c) d)
Answers: 2
Chemistry, 22.06.2019 13:30, suemmimonjaras8374
The atomic number, or number, is the described as the number of in the nucleus of an chemical element.
Answers: 1
Do you know the correct answer?
The graph shows the change in concentration of one of the species in the reaction
A + B + C→D.
Questions in other subjects:

Physics, 15.11.2020 01:20


Biology, 15.11.2020 01:30
Biology, 15.11.2020 01:30
Biology, 15.11.2020 01:30
Chemistry, 15.11.2020 01:30


