

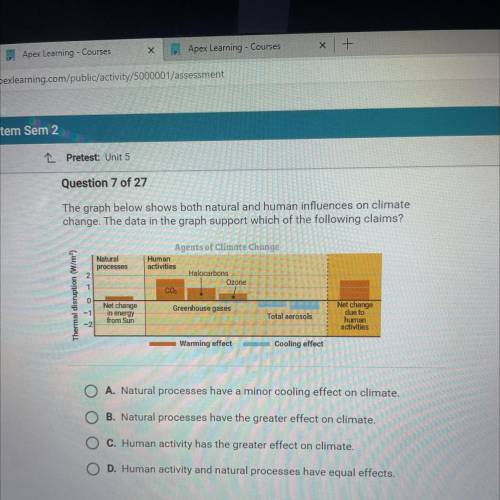
The graph below shows both natural and human influences on climate
change. The data in the graph support which of the following claims?
Natural
processes
Agents of Climate Change
Human
activities
Halocarbons
Ozone
COZ
2
1
Thermal disruption (W/m)
0
Net change
in energy
from Sun
Greenhouse gases
Total aerosols
Net change
due to
human
activities
-2
Warming effect
Cooling effect
O A. Natural processes have a minor cooling effect on climate.
B. Natural processes have the greater effect on climate.
C. Human activity has the greater effect on climate.
O D. Human activity and natural processes have equal effects.

Answers: 3


Other questions on the subject: Chemistry
Chemistry, 22.06.2019 03:30, acaciacoats
The atomic radius of sodium is 186 pm and of chlorine is 100 pm. the ionic radius for na+ is 102 pm and for cl– is 181 pm. in going from na to cl in period 3, why does the atomic radius decrease while the ionic radius increases? a. the inner electrons in the sodium cation shield its valence electrons more effectively than the inner electrons in the chloride anion do. b. the inner electrons shield the valence electrons more effectively in the chlorine atom than in the chloride anion. c. the outermost electrons in chloride experience a smaller effective nuclear charge than those in the sodium cation do. d. the outermost electrons in chloride experience a larger effective nuclear charge than those in the sodium cation do. e. monatomic ions are bigger than the atoms from which they are formed.
Answers: 2
Chemistry, 22.06.2019 11:40, arlabbe0606
Effect of rotenone and antimycin a on electron transfer rotenone, a toxic natural product from plants, strongly inhibits nadh dehydrogenase of insect and fish mitochondria. antimycin a, a toxic antibiotic, strongly inhibits the oxidation of ubiquinol. (a) explain why rotenone ingestion is lethal to some insect and fish species. (b) explain why antimycin a is a poison. (c) given that rotenone and antimycin a are equally effective in blocking their respective sites in the electron-transfer chain, which would be a more potent poison? explain.
Answers: 3
Do you know the correct answer?
The graph below shows both natural and human influences on climate
change. The data in the graph su...
Questions in other subjects:


History, 22.02.2020 19:45
History, 22.02.2020 19:45


Mathematics, 22.02.2020 19:47
Biology, 22.02.2020 19:55
Mathematics, 22.02.2020 19:55


