

Chemistry, 16.06.2021 23:30, Halessoftball
Press the yellow reset button at the bottom of the simulation screen. Under Constant Parameter, select Volume. Again,
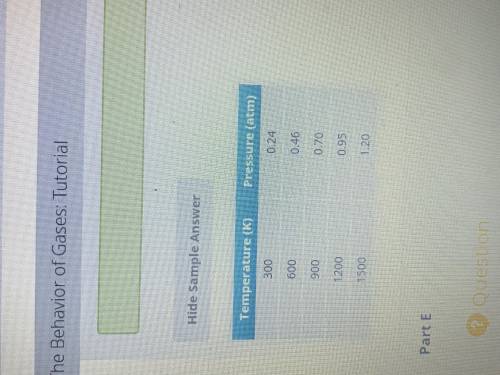
pump the pump handle once to introduce 40 to 50 gas molecules. Record the pressure in the data table.
Use the heat control to heat the gas to each of the other temperatures in the data table, and record the new pressure.
В І о
x
X
Font Sizes
A -A-3 E 3
Temperature (K)
Pressure (atm)
300
600
900
1200
1500

Answers: 1


Other questions on the subject: Chemistry
Chemistry, 22.06.2019 02:40, alexandraparava
For a patient with the following pes statement and interventions, which would be the most appropriate monitoring and evaluating data? pes statement: inadequate calcium intake related to food and nutrition related knowledge deficit as evidenced by statements that the only dietary source of calcium is milk and she believes that she is lactose intolerant. patient’s nutrition prescription is for a diet providing 1200 mg calcium per day. patient was provided with in-depth nutrition education on alternative dietary and supplement sources of calcium. a. calcium intake (at subsequent visit) b. knowledge assessment by asking patient to identify food sources from menus and shopping list (at the end of the current visit) c. serum calcium (at next visit) d. both a and b e. both a and c
Answers: 2
Chemistry, 22.06.2019 05:50, carog24
Astudent made a graph plotting the progress of a reaction over time. the student forgot to label the y-axis of the graph. a graph is shown with two graph lines. one graph line starts at a higher position on the y axis and slopes downwards towards the right. the other graph line starts at a lower position on the y axis and slopes upwards towards the right. the two graph lines stop short of intersecting each other and continue as separate lines which gradually become straight and parallel to the x axis. a vertical line is shown at a point where the two graph lines finally became parallel to the x axis. this vertical line is labeled equilibrium. the title on the x axis is time and an arrow pointing towards the right is shown above time. the title on the y axis is left blank. what best explains the label that the student should use on the y-axis? amount, because as the amount of product decreases, the amount of reactant increases over time. reaction rate, because forward and backward reaction become equal at equilibrium. amount, because the amounts of reactants and products become constant after equilibrium is reached. reaction rate, as the rate of forward reaction increases and rate of backward reaction decreases over time.
Answers: 3
Chemistry, 22.06.2019 08:00, stephstewart1209
Which of the following observations indicates that there is a small, dense, positively charged part in the center of an atom? some uncharged particles are scattered by a gold foil. all uncharged particles are attracted towards a gold foil. all positively charged particles pass straight through a gold foil. some positively charged particles bounce back from a gold foil.
Answers: 2
Do you know the correct answer?
Press the yellow reset button at the bottom of the simulation screen. Under Constant Parameter, sele...
Questions in other subjects:

Mathematics, 26.11.2020 20:50

Physics, 26.11.2020 20:50
Mathematics, 26.11.2020 20:50


Social Studies, 26.11.2020 20:50
Mathematics, 26.11.2020 20:50
Mathematics, 26.11.2020 20:50
Social Studies, 26.11.2020 21:00
Mathematics, 26.11.2020 21:00


