

Chemistry, 10.06.2021 20:30, victoriay3
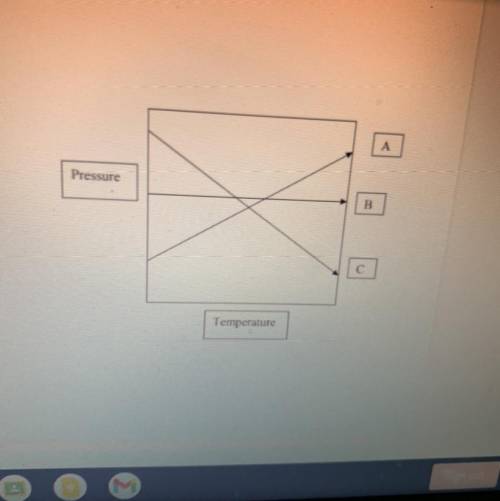
2. Which line on the graph represents the relationship
between pressure and temperature of gas?
a. Line A
b. Line B
C. Line C
Explain why you chose your

Answers: 2


Other questions on the subject: Chemistry
Chemistry, 22.06.2019 10:50, lejeanjamespete1
8) a mixture of he, ne and ar has a pressure of 7.85 atm. if the ne has a mole fraction of 0.47 and 8) ar has a mole fraction of 0.23, what is the pressure of he? a) 4.2 atm b) 3.7 atm c) 5.5 atm d) 2.4 atm e) 1.8 atm
Answers: 1
Chemistry, 22.06.2019 14:30, CoolRahim9090
Which of the following represents the ester functional group? a. -coo- b. -cho c. -cooh d. c=o
Answers: 1
Chemistry, 23.06.2019 01:00, aliviadushane
If a straight-chain hydrocarbon is a gas at room temperature, how many carbon atoms will it have? a. 6 carbon atoms b. 12 carbon atoms c. 24 carbon atoms d. 3 carbon atoms
Answers: 1
Do you know the correct answer?
2. Which line on the graph represents the relationship
between pressure and temperature of gas?
Questions in other subjects:


Computers and Technology, 10.02.2020 22:46
Physics, 10.02.2020 22:46


