

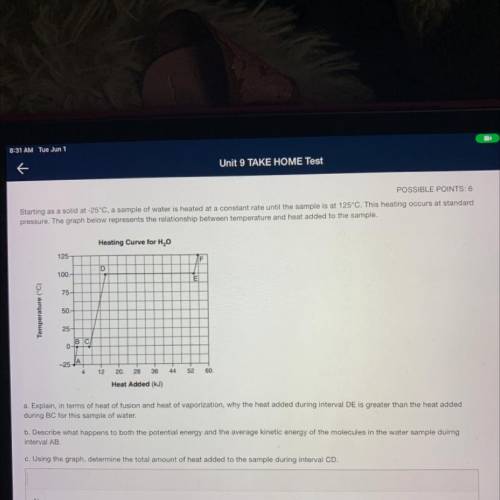
Starting as a solid at -25°C, a sample of water is heated at a constant rate until the sample is at 125°C. This heating occurs at standard
pressure. The graph below represents the relationship between temperature and heat added to the sample.
Heating Curve for H2O
125
F
D
100.
E
75
Temperature (°C)
50.
25
BC
0-
-25-
<
12
20.
28
36
44
52
60.
Heat Added (kJ)
a. Explain, in terms of heat of fusion and heat of vaporization, why the heat added during interval DE is greater than the heat added
during BC for this sample of water.
b. Describe what happens to both the potential energy and the average kinetic energy of the molecules in the water sample duirng
interval AB
c. Using the graph, determine the total amount of heat added to the sample during interval
Please hurry answering all!:)

Answers: 2


Other questions on the subject: Chemistry
Chemistry, 22.06.2019 11:30, samantha9430
Determine the reaction and balance the following equations urgent due in the morning
Answers: 2
Chemistry, 23.06.2019 12:30, arieannaensley0616
)a children’s liquid cold medicine has a density of 1.23 g/ml. if a child is to take 2.5 tsp in a dose, what is the mass in grams of this dose? (1 tsp = 5 ml)
Answers: 1
Chemistry, 23.06.2019 15:00, swelch2010
The atoms in a have a definite volume, but move quickly enough to overcome the forces of attraction between them. a. solid b. liquid c. gas
Answers: 2
Do you know the correct answer?
Starting as a solid at -25°C, a sample of water is heated at a constant rate until the sample is at...
Questions in other subjects:

Mathematics, 03.10.2021 06:30

Spanish, 03.10.2021 06:30
Mathematics, 03.10.2021 06:30

Geography, 03.10.2021 06:30


Mathematics, 03.10.2021 06:30
Mathematics, 03.10.2021 06:30


