

Chemistry, 07.05.2021 14:00, ThetPerson
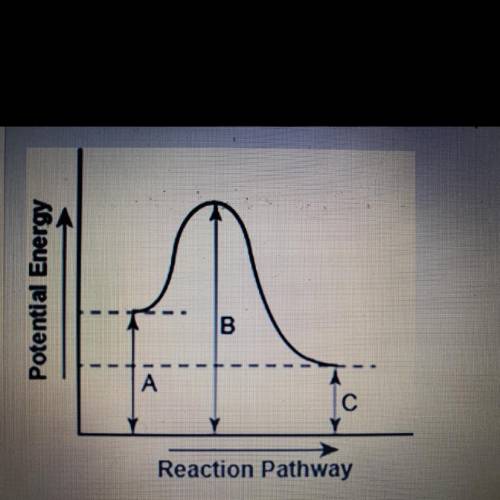
The diagram shows the potential energy changes for a reaction pathway.
Part 1: does the diagram illustrate an endothermic or an exothermic reaction? Give reasons in support of your answer.
Part 2: Describe how you can determine the total change in enthalpy and activation energy from the diagram and if each is positive or negative.

Answers: 2


Other questions on the subject: Chemistry
Chemistry, 22.06.2019 05:00, YoEsMyles3115
0.2348 grams of pbcl2 used to form 44.0 ml of solution.
Answers: 1
Chemistry, 22.06.2019 07:30, avisconti571
Label a-f based on the table using c for concentrated and d for dilute
Answers: 2
Chemistry, 22.06.2019 12:20, sindy35111
Consider the reaction of a(g) + b(g) + c(g) => d(g) for which the following data were obtained: experiment initial [a], mol/l initial [b], mol/l initial [c], mol/l initial rate, mol/l. s 1 0.0500 0.0500 0.0100 6.25 x 10^-3 2 0.100 0.0500 0.0100 2.50 x 10^-2 3 0.100 0.100 0.0100 1.00 x 10^-1 4 0.0500 0.0500 0.0200 6.25 x 10^-3 what is the rate law for the reaction?
Answers: 3
Chemistry, 22.06.2019 23:00, soccerplayer17
What is the number of neutrons in an atom with atomic mass of 35
Answers: 2
Do you know the correct answer?
The diagram shows the potential energy changes for a reaction pathway.
Part 1: does the diagram il...
Questions in other subjects:


Mathematics, 20.10.2020 04:01
Mathematics, 20.10.2020 04:01

Mathematics, 20.10.2020 04:01
Mathematics, 20.10.2020 04:01


