

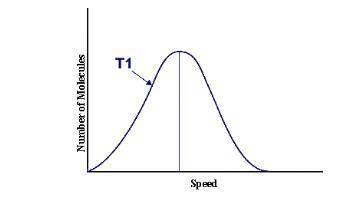
This graph represents a population of molecules in a gas versus the distribution of the average velocity(speed) of its molecules in that population. Assume all molecules to be of the same mass. In reading the graph, it is important to note three things. One, is the most probable speed is at the peak of the curve. Secondly, the most probable speed increases as the temperature increases (so shift to the right), and the distribution broadens as it increases.
On the graph, indicate the average kinetic energy of the population.
Explain your answer.
What part of the graph indicates the temperature of the sample?
Explain your answer.

Answers: 1


Other questions on the subject: Chemistry
Chemistry, 22.06.2019 15:30, lizzyhearts
Count the number of each type of atom in the equation below, and then balance the equation. write in the numbers of atoms and coefficients. add a 1 if there should be no coefficient. cs2(l) + o2(g) → co2(g) + so2(g) c [ ] s [ ] o > c [ ] s [ ] o [ ] cs2(l) + [ ] o2(g) > [ ] co2(g) + [ ] so2(g)
Answers: 3
Chemistry, 22.06.2019 23:00, lulprettyb
What is the most common reason for matter changing its state?
Answers: 1
Chemistry, 23.06.2019 00:00, juliannasl
How is the way a mixture is combined different from how a compound is combined?
Answers: 3
Do you know the correct answer?
This graph represents a population of molecules in a gas versus the distribution of the average velo...
Questions in other subjects:


Chemistry, 23.12.2019 21:31

Social Studies, 23.12.2019 21:31


