


The graph shows the solubility curve
of a substance A, at 1 atm and at different
temperatures...

Chemistry, 14.04.2021 17:00, saraderrico
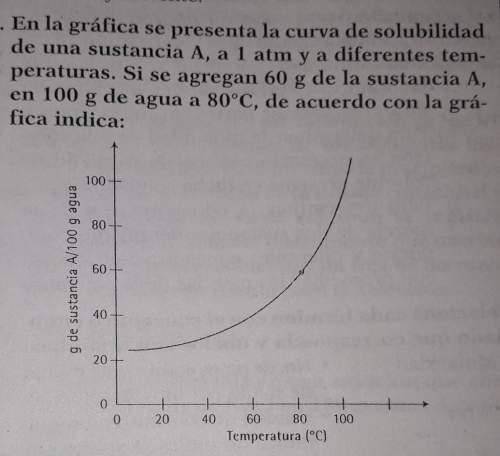
The graph shows the solubility curve
of a substance A, at 1 atm and at different
temperatures. If 60 gr of the substance are added
An in 100 g of water at 80 ºC, according to the
graph
a) Substance A is completely dissolved
b) Solute precipitation occurs
c) Classify the solution as unsaturated, saturated or
supersaturated as the case may justify your
answer.

Answers: 3
Other questions on the subject: Chemistry
Chemistry, 21.06.2019 19:00, luludawn2455
Dying the folding patterns of protein molecules can microbiologists better understand cellular processes as well as some diseases, such as alzheimer’s, that are caused by proteins that have misfolded. the folding of these complicated molecules can be simulated on computers, but it takes a lot of processor power and time for even expensive supercomputers to do this. a group of researchers at stanford university developed software that can be used to distribute the processing of data to anyone who is willing to donate time on their idle personal computers. as a result, the researchers have been able to achieve protein-folding simulations that are far better than those other computing methods have done. which statement best describes the work of these researchers? the work is not scientific because the data are not processed in one location. the work is not scientific because the simulations are not reproducible. the researchers applied creativity to solve a problem in running an experiment. the researchers used only well-established scientific techniques.
Answers: 3
Chemistry, 22.06.2019 13:30, justinerodriguz2878
What are the major types of a chemical compound
Answers: 2
Do you know the correct answer?
Questions in other subjects:

History, 26.07.2019 19:00

Arts, 26.07.2019 19:00

Biology, 26.07.2019 19:00

Mathematics, 26.07.2019 19:00

Business, 26.07.2019 19:00
Mathematics, 26.07.2019 19:00
Mathematics, 26.07.2019 19:00


