

Chemistry, 26.03.2021 18:40, katieleeisaacs8976
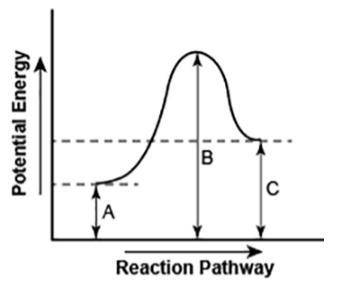
The diagram shows the potential energy changes for a reaction pathway.
A curved lined graph is shown. The y axis of the graph has the title Potential Energy. The x axis of the graph has the title Reaction Pathway. The graph curve begins at a lower level and ends at a slightly higher level. A vertical line labeled A, starting from the x axis till the beginning of the graph line is shown. A vertical line labeled B, starting from where the line labeled A ended, till the uppermost hump in the graph curve is shown. Another vertical line labeled C is shown from starting from the x axis till the point where the graph curve ends.
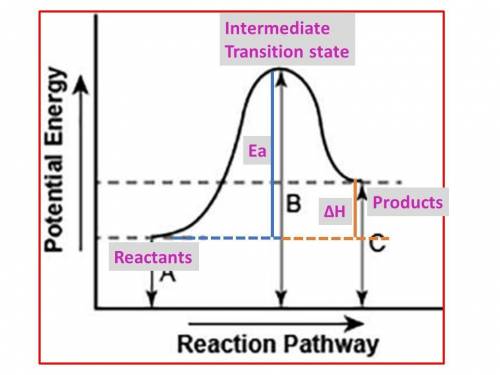
Part 1: Describe how you can determine the total change in enthalpy and activation energy from the diagram, and if each is positive or negative.
Part 2: Describe how the curve will look if the reaction was exothermic. Be sure to mention changes in the potential energies of the reactants and products and the sign changes of the enthalpy.

Answers: 3


Other questions on the subject: Chemistry
Chemistry, 21.06.2019 23:00, carter1809
What is the molecular formula for a compound that is 46.16% carbon, 5.16% hydrogen, and 48.68% fluorine? the molar mass of the compound is 156.12 g/mol
Answers: 2
Chemistry, 22.06.2019 07:30, avisconti571
Label a-f based on the table using c for concentrated and d for dilute
Answers: 2
Do you know the correct answer?
The diagram shows the potential energy changes for a reaction pathway.
A curved lined graph is show...
Questions in other subjects:


Business, 19.10.2021 14:00

Mathematics, 19.10.2021 14:00

English, 19.10.2021 14:00

Mathematics, 19.10.2021 14:00

Physics, 19.10.2021 14:00


