

Chemistry, 03.03.2021 21:10, obliviousho2018
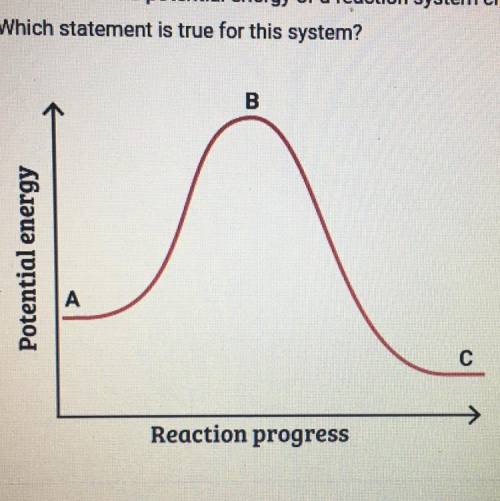
This graph shows how the potential energy of a reaction system changes
over time. Which statement is true for this system
A. The potential energy of the reactants is greater than the potential
energy of the products.
B. The height of the curve at point A represents the activation energy.
C. The height of the curve at point B represents the activation energy.
D. The potential energy of the products is greater than the potential
energy of the reactants.

Answers: 2


Other questions on the subject: Chemistry
Chemistry, 22.06.2019 12:00, sophiaa23
Which of the following is an example of physical change not a chemical change? a) a log gives off heat and light as it burns. b) a tree stores energy from the sun in its fruit. c) a penny lost in the grass slowly changes color. d) a water pipe freezes and cracks on a cold night.
Answers: 2
Chemistry, 22.06.2019 12:00, angtrevv
In a laboratory, 1.55mg of an organic compound containing carbon, hydrogen, and oxygen is burned for analysis. this combustion resulted in the formation of 1.45mg of carbon dioxide and .89 mg of water. what is the empirical formula for this compound?
Answers: 1
Chemistry, 22.06.2019 19:00, HaydenSturgis1
Which is the solubility product expression for caf2(s)?  [ca2+]/[f–]2  [ca2+][f2–]  [ca]+[f]2  [ca2+][f–]2
Answers: 3
Do you know the correct answer?
This graph shows how the potential energy of a reaction system changes
over time. Which statement i...
Questions in other subjects:


Physics, 14.07.2019 23:00

Mathematics, 14.07.2019 23:00


