

Chemistry, 25.01.2021 04:30, bartonamber4042
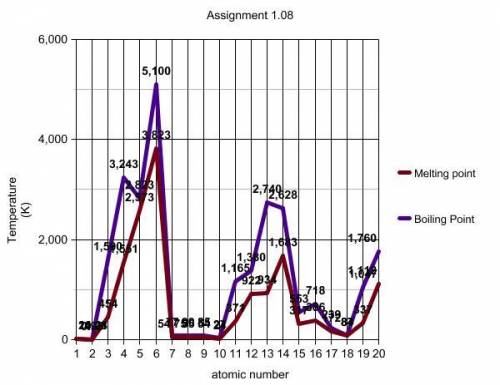
Looking at the line plots on your graph, describe how boiling point and melting point vary with respect to atomic number. Please answer using a complete sentence.
Question 1 options:
Question 2
picture of graph
Now look at the segment of the graph between the two data points marked with black squares. Describe how the boiling point and melting point plots behave between these points. (look at the yellow line)
Question 2 options:
There is an increase in melting and boiling points between elements 3 and 7.
There is a decrease in melting and boiling points between elements 3 and 7.
There is no difference in the melting and boiling points between elements 3 and 7.
Question 3
periodic table
On your graph, the data points between the black squares are data for elements with atomic numbers 3 through 9. Locate these elements on your periodic table. What term or description would you use to identify these elements with respect to the periodic table?
Question 3 options:
The elements are in the same period.
The elements are in the same group.
Question 4
picture of graph
Now look at the green lines you created by connecting the three boiling point data points and the three melting point data points. For each of these lines, describe any trends you see.
Question 4 options:
The melting points increase slightly.
The melting points decrease slightly.
There is no change in the melting points.
Question 5
picture of periodic table
Locate the elements on your periodic table that you circled in green on your graph. What term or description would you use to identify these elements with respect to the periodic table?
Question 5 options:
The elements are in the same period.
The elements are in the same group or family.
Question 6
After reviewing your answers to questions 2 and 4 above, would you define boiling point and melting point as a periodic table family trend (vertical groups), period trend (horizontal rows), or neither? Explain your answer in the next question.
Question 6 options:
It is a family trend.
It is a period trend.
It is neither a period or family trend.
Question 7
After reviewing your answers to questions 2 and 4 above, would you define boiling point and melting point as a periodic table family trend (vertical groups), period trend (horizontal rows), or neither? Explain your answer here
Question 7 options:
Skip Toolbars for .
Format
Question 8
picture of graph
Using the room temperature line (orange line) and your periodic table, make lists that identify the state of matter (gas, liquid, or solid) in which each element you plotted exists at room temperature. Explain your answers.

Answers: 3


Other questions on the subject: Chemistry
Chemistry, 22.06.2019 19:00, elizabethajih99
Sum of brother and sisters age is 26. four times the brothers age is subtracted from three times the sisters age, the difference is 8. what are the ages of the brother and sister?
Answers: 1
Chemistry, 22.06.2019 22:30, jaylenmiller437
The diagram shows the relationship between scientific disciplines. the names of some scientific disciplines have been removed from the boxes. which scientific discipline belongs in the blue box? a. physics b. biology c. chemistry d. metallurgy
Answers: 2
Chemistry, 22.06.2019 22:30, wpatskiteh7203
Draw the aromatic compound toluene (methylbenzene). show all hydrogen atoms, including those on the ring.
Answers: 1
Chemistry, 23.06.2019 03:30, jennelledenise
Mr. rose asked his student to draw a quadrilateral with four unequal sides. an example of this kind of quadrilateral
Answers: 1
Do you know the correct answer?
Looking at the line plots on your graph, describe how boiling point and melting point vary with resp...
Questions in other subjects:

Mathematics, 10.11.2020 01:30
Chemistry, 10.11.2020 01:30

Mathematics, 10.11.2020 01:30

Mathematics, 10.11.2020 01:30


