

Chemistry, 25.01.2021 04:20, masonorourke
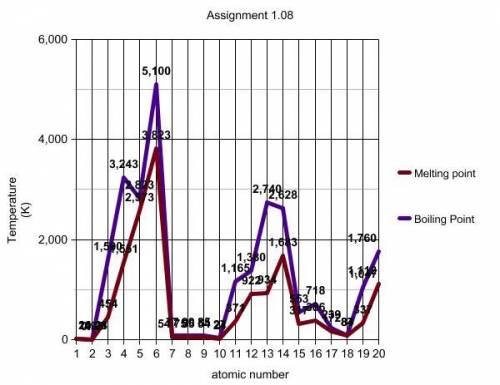
Now look at the segment of the graph between the two data points marked with black squares. Describe how the boiling point and melting point plots behave between these points. (look at the yellow line)
Question 2 options:
There is an increase in melting and boiling points between elements 3 and 7.
There is a decrease in melting and boiling points between elements 3 and 7.
There is no difference in the melting and boiling points between elements 3 and 7.
Question 3
periodic table
On your graph, the data points between the black squares are data for elements with atomic numbers 3 through 9. Locate these elements on your periodic table. What term or description would you use to identify these elements with respect to the periodic table?
Question 3 options:
The elements are in the same period.
The elements are in the same group.
Question 4
picture of graph
Now look at the green lines you created by connecting the three boiling point data points and the three melting point data points. For each of these lines, describe any trends you see.
Question 4 options:
The melting points increase slightly.
The melting points decrease slightly.
There is no change in the melting points.
Question 5
picture of periodic table
Locate the elements on your periodic table that you circled in green on your graph. What term or description would you use to identify these elements with respect to the periodic table?
Question 5 options:
The elements are in the same period.
The elements are in the same group or family.
Question 6
After reviewing your answers to questions 2 and 4 above, would you define boiling point and melting point as a periodic table family trend (vertical groups), period trend (horizontal rows), or neither? Explain your answer in the next question.
Question 6 options:
It is a family trend.
It is a period trend.
It is neither a period or family trend.
Question 7
After reviewing your answers to questions 2 and 4 above, would you define boiling point and melting point as a periodic table family trend (vertical groups), period trend (horizontal rows), or neither? Explain your answer here
Question 7 options:
Skip Toolbars for .
Format
Question 8
picture of graph
Using the room temperature line (orange line) and your periodic table, make lists that identify the state of matter (gas, liquid, or solid) in which each element you plotted exists at room temperature. Explain your answers.

Answers: 3


Other questions on the subject: Chemistry
Chemistry, 22.06.2019 00:00, annsmith66
What is the result of multiplying (2.5 × 1010) × (2.0 × 10-7)? a. 5.0 × 10³ b. 5.0 × 10⁻³ c. 5.0 × 10¹⁷ d. 5.0 × 10⁻¹⁷
Answers: 1
Chemistry, 22.06.2019 07:00, maryjane8872
Which set of characteristics best describes igneous rock? a) largest type of rock, made of organic matter, hardest type of rock b) least abundant type of rock, made of other rocks, made mostly of minerals c) found on all continents, contains wavy bands of stripes, contains fossils d) most abundant type in earth's crust, made of magma/lava, contains no fossils
Answers: 1
Chemistry, 22.06.2019 09:50, Amandachavez94
Although respiratory organs vary across different organisms, they all contain respiratory surfaces that have a large surface area and are extremely thin. explain why having an extremely thin respiratory surface with a large surface area is advantageous for the process of gas exchange
Answers: 1
Do you know the correct answer?
Now look at the segment of the graph between the two data points marked with black squares. Describe...
Questions in other subjects:


English, 21.04.2020 17:28

Mathematics, 21.04.2020 17:28


Mathematics, 21.04.2020 17:28


