

Chemistry, 14.12.2020 20:40, Hockeypro1127
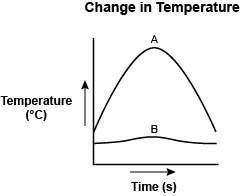
In an experiment, equal amounts of water and soil were first heated and then left to cool. The graph shows the change in temperature for each with time.
A graph with the title Change in Temperature is shown. The y axis title is Temperature in degree C and the x axis title is Time in seconds. An inverted U shaped curve labeled A is plotted. A flatter curved line labeled B is also shown plotted on the graph.
Which statement about the curves A and B is true?
Curve A represents how soil takes longer to heat and longer to cool.
Curve B represents how water takes longer to heat and longer to cool.
Curve A represents water as it heats rapidly and cools slowly.
Curve B represents soil as it heats slowly and cools rapidly.
If you don't understand, here's the image.

Answers: 1


Other questions on the subject: Chemistry
Chemistry, 22.06.2019 13:30, amandajbrewerdavis
Table sugar completely dissolved in water is an example of a?
Answers: 1
Do you know the correct answer?
In an experiment, equal amounts of water and soil were first heated and then left to cool. The graph...
Questions in other subjects:

Mathematics, 18.12.2020 04:30


History, 18.12.2020 04:30

Mathematics, 18.12.2020 04:30


